Triage Practical Solution – Malware Event – Proxy Logs Prefetch $MFT IDS
Tuesday, April 5, 2016
6
comments
Staring at your Mountain Dew you think to yourself how well your malware triage process worked on triaging the IDS alert. It’s not perfect and needs improvement to make it faster but overall the process worked. In minutes you went from IDS alerts to malware on the system. That’s a lot better than what it used to be; where IDS alerts went into the black hole of logs never to be looked at again. Taking a sip of your Mountain Dew you are ready to provide your ISO with an update.
To fill in those readers who may not know what is going on the following is the abbreviated practical scenario (for the full scenario refer to the post Triage Practical – Malware Event – Proxy Logs Prefetch $MFT IDS):
The junior security guy noticed another malware infection showing up in the IDS alerts. They grabbed a screenshot of the alerts and sent it to you by email. As soon as you received the email containing the screenshot shown below you started putting your malware triage process to the test.

Below are some of the initial questions you had to answer and report back to the ISO.
* Is this a confirmed malware security event or was the junior analyst mistaken?
* What do you think occurred on the system to cause the malware event in the first place?
* What type of malware is involved and what capabilities does it have?
* What potential risk does the malware pose to your organization?
* What recommendation(s) do you make to the security team to strengthen its security program to reduce similar incidents occurring in the future?
Despite the wealth of information available to you within an enterprise, only a subset of data was provided for you to use while triaging this malware event. The following artifacts were made available:
* IDS alerts for the timeframe in question (you need to replay the provide pcap to generate the IDS alerts. pcap is not provided for you to use during triage and was only made available to enable you to generate the IDS alerts in question)
* Parsed index.dat files to simulate proxy web logs (the parsed index.dat information was modified to remove items not typically found in a web server’s proxy logs)
* Prefetch files from the system in question (inside the Prefetch.ad1 file)
* Filesystem metadata from the system in question (the Master File Table is provided for this practical)
Each enterprise’s network is different and each one offers different information for triaging. As such, it is not possible to outline all the possible locations where this information could be located in enterprises. However, it is possible to highlight common areas where this information can be found. To those reading this post whose environments do not reflect the locations I mention then you can evaluate your network environment for a similar system containing similar information or better prepare your network environment by making sure this information starts being collected in systems.
* Proxy web logs within an enterprise can be stored on the proxy server itself and/or in a central logging system. In addition to proxy web logs, the potentially infected system will have web usage history for each web browser on the system
* IDS alerts within an enterprise can be stored on the IDS/IPS sensors themselves or centrally located through a management console and/or central logging system (i.e. SIEM)
* Prefetch files within an enterprise can be located on the potentially infected system
* File system metadata within an enterprise can be located on the potentially infected system
Knowing where information is available within an enterprise is only part of the equation. It is necessary to collect the information so it can be used for triaging. Similar to all the differences between enterprises’ networks, how information is collected varies from one organization to the next. Below are a few suggestions for how the information outlined above can be collected.
* Proxy web logs will either be located on the proxy server itself or a centralized logging solution. The collection of the logs can be as simple as running a filter in a web graphical user interface to export the logs, copying an entire text file containing log data from the server, or viewing the logs using the interface to the central logging system.
* IDS alerts don’t have to be collected. They only need to be made available so they can be reviewed. Typically this is accomplished through a management console, security monitoring dashboard, or a centralized logging solution.
* Prefetch files are stored on the potentially infected system. The collection of this artifact can be done by either pulling the files off remotely or locally. Remote options include an enterprise forensic tools such as F-Response, Encase Enterprise, or GRR Rapid Response, triage scripts such as Tr3Secure collection script, or by using the admin share since Prefetch files are not locked files. Local options can use the same options.
* File system metadata is very similar to Prefetch files because the same collection methods work for collecting it. The one exception is the file can’t be pulled off by using the admin share.
The last part of the equation is what tools one should use to examine the information that is collected. The tools I’m outlining below are the ones I used to complete the practical.
* Excel to view the text based proxy logs
* Winprefetchview to parse and examine the prefetch files
* MFT2CSV to parse and examine the $MFT file
Placeholder since none were known at the time of this post
The diagram below outlines the jIIr workflow for confirming malicious code events. The workflow is a modified version of the Securosis Malware Analysis Quant. I modified Securosis process to make it easier to use for security event analysis

Detection: the malicious code event is detected. Detection can be a result of technologies or a person reporting it. The workflow starts in response to a potential event being detected and reported.
Triage: the detected malicious code event is triaged to determine if it is a false positive or a real security event.
Compromised: after the event is triaged the first decision point is to decide if the machine could potentially be compromised. If the event is a false positive or one showing the machine couldn’t be infected then the workflow is exited and returns back to monitoring the network. If the event is confirmed or there is a strong indication it is real then the workflow continues to identifying the malware.
Malware Identified: the malware is identified two ways. The first way is identifying what the malware is including its purpose and characteristics. The second way is identifying and obtaining the malware from the actual system.
Root Cause Analysis: a quick root cause analysis is performed to determine how the machine was compromised and to identify indicators to use for scoping the incident. This root cause analysis does not call for a deep dive analysis taking hours and/or days but one only taking minutes.
Quarantine: the machine is finally quarantined from the network it is connected to. This workflow takes into account performing analysis remotely so disconnecting the machine from the network is done at a later point in the workflow. If the machine is initially disconnected after detection then analysis cannot be performed until someone either physically visits the machine or ships the machine to you. If an organization’s security monitoring and incident response capability is not mature enough to perform root cause analysis in minutes and analysis live over the wire then the Quarantine activity should occur once the decision is made about the machine being compromised.
I opted to triage this practical similar to a real security event. As a result, the post doesn’t use all of the supplied information and the approach is more focused on speed. The triage process started with the IDS alert screenshot the junior security analyst saw then proceeded to the proxy logs before zeroing in on the system in question.
The screenshot below is the one supplied by the junior security analyst. In this practical it was not necessary to replay the packet capture to generate these IDS alerts since the screenshot supplied enough information.

Typically you can gain a lot of context about a security event by first exploring the IDS signatures themselves. Gaining context around a security event solely using the IDS signature names becomes second nature by doing event triage analysis on a daily basis. Analysts tend to see similar attacks triggering similar IDS alerts over time; making it easier to remember what attacks are and the traces they leave in networks. For other analysts this is where Google becomes their best friend. The screenshot shows three distinct events related to the malware in this security incident.
1. ET CURRENT_EVENTS Possible Dyre SSL Cert: these signatures indicate a possible SSL certificate for the Dyre malware. Dyre is a banking Trojan and it uses SSL to encrypt its communication. The practical did not include this but another way to detect this activity is by consuming the SSL Blacklist and comparing it against an organization’s firewall logs or netflow data to see if any internal hosts are communicating with known IP addresses associated with Dyre
2. ET POLICY Internal Host Retrieving External IP via icanhazip[.]com: this signature flags an internal host that contacts a known website associated with identifying the public IP address. Depending on the organization this may or may not be normal behavior for web browsing and/or end users. However, some malware tries to identify the public facing IP address, which will trigger this IDS signature
3. ET TROJAN Common Upatre Header Structure: this signature flags traffic associated with the Upatre Trojan. Upatre is a downloader that installs other programs.
One of the IDS alerts could had been a false positive but it is unlikely for this sequence of alerts all to be false positives. This confirms what the junior analyst believed about the machine being compromised. Specifically, the machine was infected with the Upatre downloader, which then proceeded to install the Dyre banking Trojan.
IDS alerts provide additional information that can be used in other data sources. The practical doesn’t provide the date and time when the IDS signatures fired but it does provide the destination IP addresses and domain name the machine communicated with. These IP addresses were used to correlate the IDS alerts to activity recorded in the web proxy logs. The web_logs.csv file was imported into Excel and the data was sorted using the date. This puts the log entries chronological order making it easier to perform analysis.
The web logs provided with the practical were very basic. The only information recorded was the date/time, URL, and username. Unfortunately, the destination IP address was not recorded, which is typical with web proxies. As a result, the logs did not contain any entries for the IP addresses 72.175.10.116 and 104.238.141.75.
The search on the domain icanhazip[.]com also came up empty. At this point the web proxy logs provide no additional information with a date and time to go on. This analysis did reveal these web proxy logs suck and the organization needs to make it a priority to record more information to make analysis easier. The organization also needs to ensure the network routes all HTTP/HTTPs web traffic through the proxy so it gets recorded and prevents users and programs from bypassing it.
At this point in the analysis the machine in question needs to be triaged. Reviewing programs executing on a system is a quick technique to identify malicious programs on a system. The high level indicators I tend to look are below:
* Programs executing from temporary or cache folders
* Programs executing from user profiles (AppData, Roaming, Local, etc)
* Programs executing from C:\ProgramData or All Users profile
* Programs executing from C:\RECYCLER
* Programs stored as Alternate Data Streams (i.e. C:\Windows\System32:svchost.exe)
* Programs with random and unusual file names
* Windows programs located in wrong folders (i.e. C:\Windows\svchost.exe)
* Other activity on the system around suspicious files
The collected prefetch files were parsed with Winprefetchview and I initially sorted by process path. I reviewed the parsed prefetch files using the general indicators I mentioned previously and I found the suspicious program highlighted in red.

The first suspicious program was SCAN_001_140815_881[1].SCR executing from the Temporary Internet Files directory. The program was suspicious because it is executing from the lab user profile and its name resembles a document name instead of a screensaver name. To gain more context around the suspicious program I then sorted by the Last Run time to see what else was executing around this time.

The SCAN_001_140815_881[1].SCR program executed at 8/15/2015 5:49:51 AM UTC. Shortly thereafter another executed named EJZZTA8.EXE executed from user’s Temp directory at 8/15/2015 5:51:03 AM UTC. Both prefetch files did not reference any other suspicious executables in their file handles. At this point not only do I have two suspicious files of interest but I also identified the exact date and time when the security event occurred.
The date and time of the incident obtained from the Prefetch files can now be used to correlate the IDS alerts and suspicious programs to the activity in the web proxy logs. The picture below shows leading up to when the SCAN_001_140815_881[1].SCR program executed the user was accessing Yahoo email.

The rest of the web logs continued to show the user interacting with Yahoo email around the time the infection occurred. However, the web logs don’t record the entry showing where the SCAN_001_140815_881[1].SCR program came from. This occurred either because the web proxy didn’t record it or the web proxy sucks by not recording it. I’m going with latter since the web proxy logs are missing a lot of information.

At this point the IDS alerts revealed the system in question had network activity related to the Upatre downloader and Dyre banking Trojans. The prefetch files revealed suspicious programs named SCAN_001_140815_881[1].SCR that executed at 8/15/2015 5:49:51 AM UTC and EJZZTA8.EXE that executed at 8/15/2015 5:51:03 AM UTC. The web proxy logs showed the user was accessing Yahoo email around the time the programs executed. The next step in the triage process is to examine the file system metadata to identify any other malicious software on the system and to try to confirm the initial infection vector. I reviewed the metadata in a timeline to make it easier to see the activity for the time of interest.
For this practical I leveraged the MFT2CSV program in the configuration below to generate a timeline. However, an effective and faster technique - but not free - is using the home plate feature in Encase Enterprise against a remote system live. This enables you to triage the system live instead of trying to collect files from the system for offline analysis.

In the timeline I went to the time of interest, which was 8/15/2015 5:49:51 AM UTC. I then proceed forward in time to identify any other suspicious files. The first portion of the timeline didn’t show any new activity of interest around the SCAN_001_140815_881[1].SCR file.

Continuing going through the timeline going forward in time lead me to the next file EJZZTA8.EXE. The activity between these two files only showed files being created in the Temporary Internet Files and Cookies directories indicating the user was surfing the Internet.

At this point the timeline did not provide any new information and the last analysis step is to triage the suspicious programs found.
The first program SCAN_001_140815_881[1].SCR was no longer on the system but the second program (EJZZTA8.EXE) was. The practical file file_hash_list.csv showed the EJZZTA8.EXE’s MD5 hash was f26fd37d263289cb7ad002fec50922c7. The first search was to determine if anyone uploaded the file to VirusTotal and a VirusTotal report was available. Numerous antivirus detections confirmed the program was Upatre, which matches one of the triggered IDS signatures.
A Google search of the hash located a Hybrid Analysis report and Malware report. The Hybrid Analysis report confirm the sample sends network traffic. This information could then be used to scope the incident to identify potentially other infected machines.

The resources section in the program contains an icon confirming the file tried to mimic a document. This makes me conclude it was a social engineering attack against the user.

The reports contained other information that one could use to identify other infected systems in the enterprise. However, as it relates to the practical there wasn’t much additional information I needed to complete my triage analysis. The next step would be to contact the end user to get the phishing email and then request for the email to be purged from all users’ inboxes.
The triage process did confirm the system was infected with malicious code. The evidence that was present on the system and the lack of other attack vector artifacts (i.e. exploits, vulnerable programs executing, etc.) leads me to believe the system was infected due to a phishing email. The email contained some mechanism to get the user to initiate the infection. The risk to the organization is twofold. One of the malicious programs downloads and installs other malware. The other malicious program tries to capture and exhilarate credentials from the system. The next step would be to escalate the malware event to the incident response process so the system can be quarantined, system can be cleaned, end user can be contacted to get the phishing email and then it can be determined why end users have access to web email instead of using the organization's email system.
Triage Scenario
To fill in those readers who may not know what is going on the following is the abbreviated practical scenario (for the full scenario refer to the post Triage Practical – Malware Event – Proxy Logs Prefetch $MFT IDS):
The junior security guy noticed another malware infection showing up in the IDS alerts. They grabbed a screenshot of the alerts and sent it to you by email. As soon as you received the email containing the screenshot shown below you started putting your malware triage process to the test.
Below are some of the initial questions you had to answer and report back to the ISO.
* Is this a confirmed malware security event or was the junior analyst mistaken?
* What do you think occurred on the system to cause the malware event in the first place?
* What type of malware is involved and what capabilities does it have?
* What potential risk does the malware pose to your organization?
* What recommendation(s) do you make to the security team to strengthen its security program to reduce similar incidents occurring in the future?
Information Available
Despite the wealth of information available to you within an enterprise, only a subset of data was provided for you to use while triaging this malware event. The following artifacts were made available:
* IDS alerts for the timeframe in question (you need to replay the provide pcap to generate the IDS alerts. pcap is not provided for you to use during triage and was only made available to enable you to generate the IDS alerts in question)
* Parsed index.dat files to simulate proxy web logs (the parsed index.dat information was modified to remove items not typically found in a web server’s proxy logs)
* Prefetch files from the system in question (inside the Prefetch.ad1 file)
* Filesystem metadata from the system in question (the Master File Table is provided for this practical)
Information Storage Location within an Enterprise
Each enterprise’s network is different and each one offers different information for triaging. As such, it is not possible to outline all the possible locations where this information could be located in enterprises. However, it is possible to highlight common areas where this information can be found. To those reading this post whose environments do not reflect the locations I mention then you can evaluate your network environment for a similar system containing similar information or better prepare your network environment by making sure this information starts being collected in systems.
* Proxy web logs within an enterprise can be stored on the proxy server itself and/or in a central logging system. In addition to proxy web logs, the potentially infected system will have web usage history for each web browser on the system
* IDS alerts within an enterprise can be stored on the IDS/IPS sensors themselves or centrally located through a management console and/or central logging system (i.e. SIEM)
* Prefetch files within an enterprise can be located on the potentially infected system
* File system metadata within an enterprise can be located on the potentially infected system
Collecting the Information from the Storage Locations
Knowing where information is available within an enterprise is only part of the equation. It is necessary to collect the information so it can be used for triaging. Similar to all the differences between enterprises’ networks, how information is collected varies from one organization to the next. Below are a few suggestions for how the information outlined above can be collected.
* Proxy web logs will either be located on the proxy server itself or a centralized logging solution. The collection of the logs can be as simple as running a filter in a web graphical user interface to export the logs, copying an entire text file containing log data from the server, or viewing the logs using the interface to the central logging system.
* IDS alerts don’t have to be collected. They only need to be made available so they can be reviewed. Typically this is accomplished through a management console, security monitoring dashboard, or a centralized logging solution.
* Prefetch files are stored on the potentially infected system. The collection of this artifact can be done by either pulling the files off remotely or locally. Remote options include an enterprise forensic tools such as F-Response, Encase Enterprise, or GRR Rapid Response, triage scripts such as Tr3Secure collection script, or by using the admin share since Prefetch files are not locked files. Local options can use the same options.
* File system metadata is very similar to Prefetch files because the same collection methods work for collecting it. The one exception is the file can’t be pulled off by using the admin share.
Potential DFIR Tools to Use
The last part of the equation is what tools one should use to examine the information that is collected. The tools I’m outlining below are the ones I used to complete the practical.
* Excel to view the text based proxy logs
* Winprefetchview to parse and examine the prefetch files
* MFT2CSV to parse and examine the $MFT file
Others’ Approaches to Triaging the Malware Event
Placeholder since none were known at the time of this post
Partial Malware Event Triage Workflow
The diagram below outlines the jIIr workflow for confirming malicious code events. The workflow is a modified version of the Securosis Malware Analysis Quant. I modified Securosis process to make it easier to use for security event analysis

Detection: the malicious code event is detected. Detection can be a result of technologies or a person reporting it. The workflow starts in response to a potential event being detected and reported.
Triage: the detected malicious code event is triaged to determine if it is a false positive or a real security event.
Compromised: after the event is triaged the first decision point is to decide if the machine could potentially be compromised. If the event is a false positive or one showing the machine couldn’t be infected then the workflow is exited and returns back to monitoring the network. If the event is confirmed or there is a strong indication it is real then the workflow continues to identifying the malware.
Malware Identified: the malware is identified two ways. The first way is identifying what the malware is including its purpose and characteristics. The second way is identifying and obtaining the malware from the actual system.
Root Cause Analysis: a quick root cause analysis is performed to determine how the machine was compromised and to identify indicators to use for scoping the incident. This root cause analysis does not call for a deep dive analysis taking hours and/or days but one only taking minutes.
Quarantine: the machine is finally quarantined from the network it is connected to. This workflow takes into account performing analysis remotely so disconnecting the machine from the network is done at a later point in the workflow. If the machine is initially disconnected after detection then analysis cannot be performed until someone either physically visits the machine or ships the machine to you. If an organization’s security monitoring and incident response capability is not mature enough to perform root cause analysis in minutes and analysis live over the wire then the Quarantine activity should occur once the decision is made about the machine being compromised.
Triage Analysis Solution
I opted to triage this practical similar to a real security event. As a result, the post doesn’t use all of the supplied information and the approach is more focused on speed. The triage process started with the IDS alert screenshot the junior security analyst saw then proceeded to the proxy logs before zeroing in on the system in question.
IDS alerts
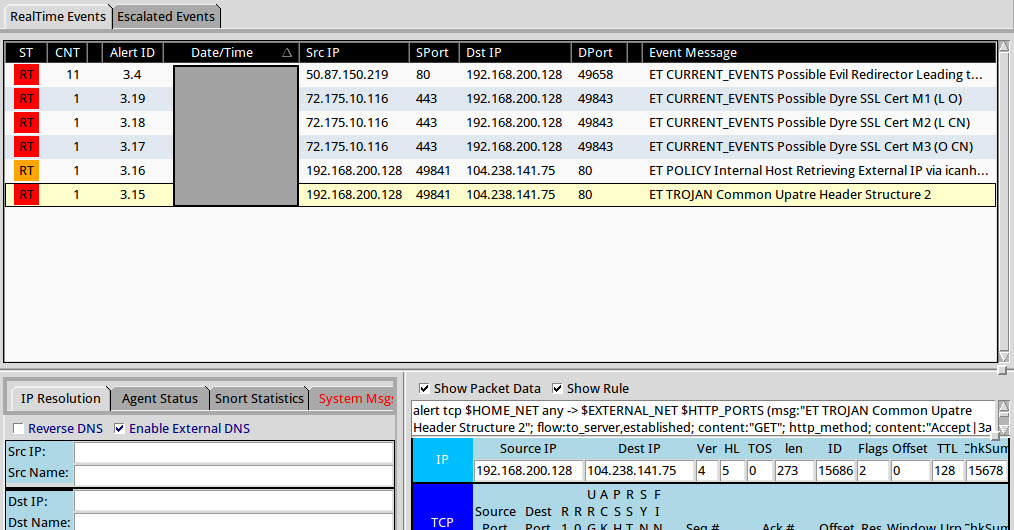
The screenshot below is the one supplied by the junior security analyst. In this practical it was not necessary to replay the packet capture to generate these IDS alerts since the screenshot supplied enough information.

Typically you can gain a lot of context about a security event by first exploring the IDS signatures themselves. Gaining context around a security event solely using the IDS signature names becomes second nature by doing event triage analysis on a daily basis. Analysts tend to see similar attacks triggering similar IDS alerts over time; making it easier to remember what attacks are and the traces they leave in networks. For other analysts this is where Google becomes their best friend. The screenshot shows three distinct events related to the malware in this security incident.
1. ET CURRENT_EVENTS Possible Dyre SSL Cert: these signatures indicate a possible SSL certificate for the Dyre malware. Dyre is a banking Trojan and it uses SSL to encrypt its communication. The practical did not include this but another way to detect this activity is by consuming the SSL Blacklist and comparing it against an organization’s firewall logs or netflow data to see if any internal hosts are communicating with known IP addresses associated with Dyre
2. ET POLICY Internal Host Retrieving External IP via icanhazip[.]com: this signature flags an internal host that contacts a known website associated with identifying the public IP address. Depending on the organization this may or may not be normal behavior for web browsing and/or end users. However, some malware tries to identify the public facing IP address, which will trigger this IDS signature
3. ET TROJAN Common Upatre Header Structure: this signature flags traffic associated with the Upatre Trojan. Upatre is a downloader that installs other programs.
One of the IDS alerts could had been a false positive but it is unlikely for this sequence of alerts all to be false positives. This confirms what the junior analyst believed about the machine being compromised. Specifically, the machine was infected with the Upatre downloader, which then proceeded to install the Dyre banking Trojan.
Web Proxy Logs
IDS alerts provide additional information that can be used in other data sources. The practical doesn’t provide the date and time when the IDS signatures fired but it does provide the destination IP addresses and domain name the machine communicated with. These IP addresses were used to correlate the IDS alerts to activity recorded in the web proxy logs. The web_logs.csv file was imported into Excel and the data was sorted using the date. This puts the log entries chronological order making it easier to perform analysis.
The web logs provided with the practical were very basic. The only information recorded was the date/time, URL, and username. Unfortunately, the destination IP address was not recorded, which is typical with web proxies. As a result, the logs did not contain any entries for the IP addresses 72.175.10.116 and 104.238.141.75.
The search on the domain icanhazip[.]com also came up empty. At this point the web proxy logs provide no additional information with a date and time to go on. This analysis did reveal these web proxy logs suck and the organization needs to make it a priority to record more information to make analysis easier. The organization also needs to ensure the network routes all HTTP/HTTPs web traffic through the proxy so it gets recorded and prevents users and programs from bypassing it.
Prefetch files
At this point in the analysis the machine in question needs to be triaged. Reviewing programs executing on a system is a quick technique to identify malicious programs on a system. The high level indicators I tend to look are below:
* Programs executing from temporary or cache folders
* Programs executing from user profiles (AppData, Roaming, Local, etc)
* Programs executing from C:\ProgramData or All Users profile
* Programs executing from C:\RECYCLER
* Programs stored as Alternate Data Streams (i.e. C:\Windows\System32:svchost.exe)
* Programs with random and unusual file names
* Windows programs located in wrong folders (i.e. C:\Windows\svchost.exe)
* Other activity on the system around suspicious files
The collected prefetch files were parsed with Winprefetchview and I initially sorted by process path. I reviewed the parsed prefetch files using the general indicators I mentioned previously and I found the suspicious program highlighted in red.

The first suspicious program was SCAN_001_140815_881[1].SCR executing from the Temporary Internet Files directory. The program was suspicious because it is executing from the lab user profile and its name resembles a document name instead of a screensaver name. To gain more context around the suspicious program I then sorted by the Last Run time to see what else was executing around this time.

The SCAN_001_140815_881[1].SCR program executed at 8/15/2015 5:49:51 AM UTC. Shortly thereafter another executed named EJZZTA8.EXE executed from user’s Temp directory at 8/15/2015 5:51:03 AM UTC. Both prefetch files did not reference any other suspicious executables in their file handles. At this point not only do I have two suspicious files of interest but I also identified the exact date and time when the security event occurred.
Web Proxy Logs Redux
The date and time of the incident obtained from the Prefetch files can now be used to correlate the IDS alerts and suspicious programs to the activity in the web proxy logs. The picture below shows leading up to when the SCAN_001_140815_881[1].SCR program executed the user was accessing Yahoo email.

The rest of the web logs continued to show the user interacting with Yahoo email around the time the infection occurred. However, the web logs don’t record the entry showing where the SCAN_001_140815_881[1].SCR program came from. This occurred either because the web proxy didn’t record it or the web proxy sucks by not recording it. I’m going with latter since the web proxy logs are missing a lot of information.

File system metadata
At this point the IDS alerts revealed the system in question had network activity related to the Upatre downloader and Dyre banking Trojans. The prefetch files revealed suspicious programs named SCAN_001_140815_881[1].SCR that executed at 8/15/2015 5:49:51 AM UTC and EJZZTA8.EXE that executed at 8/15/2015 5:51:03 AM UTC. The web proxy logs showed the user was accessing Yahoo email around the time the programs executed. The next step in the triage process is to examine the file system metadata to identify any other malicious software on the system and to try to confirm the initial infection vector. I reviewed the metadata in a timeline to make it easier to see the activity for the time of interest.
For this practical I leveraged the MFT2CSV program in the configuration below to generate a timeline. However, an effective and faster technique - but not free - is using the home plate feature in Encase Enterprise against a remote system live. This enables you to triage the system live instead of trying to collect files from the system for offline analysis.

In the timeline I went to the time of interest, which was 8/15/2015 5:49:51 AM UTC. I then proceed forward in time to identify any other suspicious files. The first portion of the timeline didn’t show any new activity of interest around the SCAN_001_140815_881[1].SCR file.

Continuing going through the timeline going forward in time lead me to the next file EJZZTA8.EXE. The activity between these two files only showed files being created in the Temporary Internet Files and Cookies directories indicating the user was surfing the Internet.

At this point the timeline did not provide any new information and the last analysis step is to triage the suspicious programs found.
Researching Suspicious Files
The first program SCAN_001_140815_881[1].SCR was no longer on the system but the second program (EJZZTA8.EXE) was. The practical file file_hash_list.csv showed the EJZZTA8.EXE’s MD5 hash was f26fd37d263289cb7ad002fec50922c7. The first search was to determine if anyone uploaded the file to VirusTotal and a VirusTotal report was available. Numerous antivirus detections confirmed the program was Upatre, which matches one of the triggered IDS signatures.
A Google search of the hash located a Hybrid Analysis report and Malware report. The Hybrid Analysis report confirm the sample sends network traffic. This information could then be used to scope the incident to identify potentially other infected machines.

The resources section in the program contains an icon confirming the file tried to mimic a document. This makes me conclude it was a social engineering attack against the user.

The reports contained other information that one could use to identify other infected systems in the enterprise. However, as it relates to the practical there wasn’t much additional information I needed to complete my triage analysis. The next step would be to contact the end user to get the phishing email and then request for the email to be purged from all users’ inboxes.
Triage Analysis Wrap-up
The triage process did confirm the system was infected with malicious code. The evidence that was present on the system and the lack of other attack vector artifacts (i.e. exploits, vulnerable programs executing, etc.) leads me to believe the system was infected due to a phishing email. The email contained some mechanism to get the user to initiate the infection. The risk to the organization is twofold. One of the malicious programs downloads and installs other malware. The other malicious program tries to capture and exhilarate credentials from the system. The next step would be to escalate the malware event to the incident response process so the system can be quarantined, system can be cleaned, end user can be contacted to get the phishing email and then it can be determined why end users have access to web email instead of using the organization's email system.


 Posts
Posts

