skip to main |
skip to sidebar
Sunday, January 4, 2015
Posted by
Corey Harrell
Change is one of the only constants in incident response. In time most things will change; technology, tools, processes, and techniques all eventually change. The change is not only limited to the things we rely on to be the last line of defense for our organizations and/or customers. The threats we are protecting them against change too. One recent example is the Angler exploit kit incorporating fileless malware. Malware that never hits the hard drive is not new but this change is pretty significant. An exploit kit is using the technique so the impact is more far reaching than the previous instances where fileless malware has been used (to my knowledge.) In this post I'm walking through the process one can use to triage a system potentially impacted by fileless malware. The post is focused on Poweliks but the process applies to any fileless malware.
Background on Why This Matters
In my RSS feeds, I was following the various articles about how an exploit kit incorporated the use of fileless malware. The malware never gets dropped to the disk and gets loaded directly into memory. A few of the articles I'm referring to are: Poweliks: The file-less little malware that could, Angler EK : now capable of "fileless" infection (memory malware), Fileless Infections from Exploit Kit: An Overview, POWELIKS: Malware Hides In Windows Registry, and POWELIKS Levels Up With New Autostart Mechanism. Reading the articles made one thing clear: one of the most effective tools to deliver malware (exploit kits) is now using malware that stays in memory.
This change has a significant impact on multiple areas. If the malware stays in memory then the typically artifacts we see on the host will not be there. For example, when the malware is loaded into memory then it won't create program execution artifacts on the system. This means the triage and examination process needs to adjust. As I mentioned previously, this change was implemented into a widely known exploit kit (Angler exploit kit.) The systems infected with this exploit kit can be far reaching. This means we will encounter this change sooner rather than later; if you haven't faced it already. Case in point, recently the Internet Systems Consortium website was compromised and was redirecting visitors to the Angler exploit kit. The last impact is if this change provides better results for the people behind it then I can see other exploit kit authors following suit. This means fileless malware may become even more widespread and it's something that is here to stay.
I knew memory forensics is one technique we can use to find the malware in memory. (if you need a great reference on how to do this check out the book the Art of Memory Forensics.) However, the question remained what does this look like. I took the short route for a quick answer to my question by reaching out to my Twitter followers. I asked them the following: "Anyone know how Poweliks code looks from memory forensics perspective?"
The first responses I got back was from Adam over at the Hexacron blog (great blog by the way) as shown below.
Adam provided some great information; to narrow in on the dllhost.exe process and what strings to look for. Another response I got was from @lstaPee as shown below:
@lstaPee provided a few more tidbits. RunDll32.exe injects code into the Dllhost.exe and dllhost.exe should have network connections. The response I got back from Twitter was great but I really needed to address the bigger question. If and when I have to triage a system infected with Poweliks what is the fastest way to perform the triage to locate the malware and determine the root cause of the infection. A question I needed to dig in to in order to find out the answer.
Testing Environment
As much as I wanted to simulate this attack by finding a live link to an Angler exploit kit I knew it would be very difficult. Based on various articles I read, Angler is VMware aware and it doesn't always deliverer the fileless malware. I opted to use a Powelik's dropper/downloader. I used the sample MD5 0181850239cd26b8fb8b72afb0e95eac I found on Malwr. The test system was a Windows 7 32bit virtual machine in VMware.
The test conditions were really basic. I executed the sample by clicking it and then waited for about a minute. The VM was suspended and I collected the memory and prefetch files. I then unsuspended the VM followed by rebooting the system. After reboot, I logged onto the VM and then suspended it to collect the memory and prefetch files.
My tests was to analyze the Poweliks infection from two angles. The initial infection prior to a system reboot and a persistent infection after the system reboots. My analysis had one exception. By clicking the Poweliks executable to infect the system this action created program execution artifacts. I ignored these artifacts since they wouldn't be present if the malware was loaded directly into memory. I followed my typical examination process on the memory images and vmdk files but this post only highlights the activity that directly points to Poweliks. There was other activity of interest but the activity by itself does not indicate anything malicious. This activity I opted to omit from the post.
Poweliks' Behavior
Before diving into the triage process and what to look for it's important I discuss one Poweliks' behavior. I won't go into any details how I first picked up on this but I will show the end result. What the behavior is and how it can help when triaging Poweliks specifically. The screenshot below shows partial of the Malwr's behavior analysis section showing the behavior I'm referring to.
Upon a system's initial infection, the malware calls rundll32.exe which then calls powershell.exe who injects code into the dllhost.exe process. In the image above the numbers are for the process IDs and this relevant as we dig deeper into the behavior.
The image below shows activity that occurs shortly after the rundll32.exe process starts. As can be seen, rundll32.exe attempts to load a module into its own address space with the LdrLoadDll function. The module being loaded is actually javascript; this behavior is well documented for Poweliks such as in the article Poweliks – Command Line Confusion. Notice the activity following the LdrLoadDll function call is trying to locate the address for the RunHTMLApplication function. Here's the keyword Adam pointed out.
The images below shows activity that occurs just prior to powershell.exe process exiting. Powershell.exe creates the dllhost.exe process in the suspended state. Code gets injected into this suspended dllhost.exe process and then it is resumed. This technique is process hollowing and when the suspended process is resumed it executes the injected code.
Triaging System Infected with Poweliks
Triage is the assessment of a security event to determine if there is a security incident, its priority, and the need for escalation. As it relates to potential malware incidents, the purpose of triaging may vary. In this instance, triage is being used to determine if an event is a security incident or false positive by identifying malware on the system. Confirming the presence of malware allows for a deeper examination to be completed. The triage process I'm outlining is to confirm the presence of the Poweliks fileless malware.
Triaging with Host Artifacts
Normally, triaging a system using artifacts on the host is an effective technique to identify malware. This is especially true when leveraging program execution artifacts. However, loading malware directly into memory has a significant impact on the artifacts available on the host. There are very little artifacts available and if the malware doesn't remain persistent then there will be even less. Triaging a system infected with Poweliks is no different. Most of the typically artifacts are missing but it can still be identified using prefetch files and autorun locations.
Prefetch Files
Previously I outlined the Poweliks behavior where the rundll32.exe process runs, which then starts a powershell.exe process before injecting code into the dllhost.exe suspended process. This behavior is apparent in the prefetch files at the point of the initial infection. The image below shows the activity.
The prefetch files show the sequence of rundll32.exe executing followed by powershell.exe before dllhost.exe. Furthermore, the dllhost.exe prefetch file is missing the process path. The missing process path indicates process hollowing was used as I outlined in the post Prefetch File Meet Process Hollowing. The prefetch files contain references to files accessed during the first 10 seconds of application startup. The dllhost.exe prefetch file contains revealing ones. It contains a reference to wininet.dll for interacting with the network and files associated with Internet Explorer as shown below.
This specific prefetch file sequence only occurs upon the initial infection. Future system restarts where Poweliks is loaded into the dllhost.exe process only shows the dllhost.exe prefetch file. The file references in this prefetch still show references to files located in the user profile.
Autoruns
The prefetch files contain a distinctive pattern indicating a Poweliks infection. Depending on the sample, autoruns can reveal even more. I mention depending on the sample because Poweliks has changed its persistence mechanism. Initially it used the Run registry key before moving on to a CLSID registry key. I thought one article mentioned Poweliks may not try to remain persistent at all times. If Poweliks does try to remain persistent then its mechanism can be used to find it. Keep in mind, Poweliks has taken self protection measures to prevent this mechanism from being located on a live system. The easiest method to bypass these measures is to access the system remotely with a forensic tool like Encase Enterprise, mount the drive, and then run Regripper across the hives.
The image below shows the Run key from the user account on my test system. The sample I used was older since the Run key was used but it still is a tell-tale sign for a Poweliks infection.
...snip....
Memory Analysis Triage
Fileless malware may leave very little artifacts available on the host's hard drive but it still has to reside in memory. The most effective technique to identify a fileless malware infection is memory forensics. A Poweliks infection is not an exception since it stands out in memory whether if the memory is examined after the initial infection or a system reboot.
Network Connections
One area with malware indications is network activity are for unusual processes. @lstaPee alluded to this in their tweet about Poweliks. The Volatility netscan plug-in does show network activity for the dllhost.exe process involving the IP address 178.89.159.35 on port 80 for HTTP traffic. dllhost.exe is not a process typically associated with web traffic so this makes it a good indicator pointing to Poweliks.
Process Listing
Another area with malware indications is the process listing showing unusual ones or ones with unusual commands. The Volatility pslist, psscan, and pstree -v plugins did not reveal anything that could definitely be used as an indicator but they did show the dllhost.exe process running. I checked a few clean systems to see if dllhost.exe normally runs but the process was not running by default. This doesn't mean it can be used as an indicator because there could be other reasons for dllhost.exe running besides Poweliks. The screen below is from the pstree plug-in showing the command-line for launching dllhost.exe (notice there are no other options used in the command.)
Injected Code
Looking for processes with injected code is an effective technique to locate malware on a system. This is the one technique that absolutely reveals Poweliks on a system. The Volatility malfind plug-in showed the dllhost.exe process with injected code. This matches up to the articles about the malware and behavior analysis showing code does get injected into the dllhost.exe process. The image below shows the partial output from malfind.
Extracting the injected code and scanning it with antivirus confirms it is Poweliks. The image below shows the VirusTotal results for the injected code. Microsoft detected the code as Trojan:Win32/Powessere.A which is their classification for Poweliks.
Strings
The last area containing indicators pointing to Poweliks are the strings in the dllhost.exe process. The method to review the strings is not as straight forward as running a single Volatility plug-in. The strings command reference walks through the process and it's the one I used. The only thing I did different was to grep for my process ID to make the strings easier to review. The dllhost.exe strings revealed URLs such as one containing the IP address found with the netscan plug-in.
The most significant string found was the command used to make rundll32.exe inject code into the dllhost.exe process as shown below. The presence of this string alone in the dllhost.exe process indicates the system is infected with Poweliks.
Wrapping Things Up
The change introduce by the Angler exploit kit creator(s) is causing us to make adjustments in our processes. The effective techniques we used in the past may not be as effective against fileless malware. However, it doesn't mean nothing is effective preventing us from triaging these systems. It only means we need to use other processes, techniques, and tools we have at our disposal. We need to take what artifacts do remain and use it to our advantage. This post was specific to the Poweliks malware but the techniques discussed will apply to other fileless malware. The only difference will be what data is actually found in the artifacts.
Wednesday, November 5, 2014
Posted by
Corey Harrell
An alert fires about an end point potentially having a security issue. The end point is not in the cubicle next to you, not down the hall, and not even in the same city. It's miles away in one of your organization's remote locations. Or maybe the end point is not miles away but a few floors from you. However, despite its closeness the system has a one terabyte hard drive in it. The alert fired and the end point needs to be triaged but what options do you have. Do you spend the time to physically track down the end point, remove the hard drive, image the drive, and then start your analysis. How much time and resources would be spent approaching triage in this manner? How many other alerts would be overlooked while the focus is on just one? How much time and resources would be wasted if the alert was a false positive? In this post I'll demonstrate how the Tr3secure collection script can be leveraged to triage this type of alert.
Efficiency and Speed Matters
Triaging requires a delicate balance between thoroughness and speed. Too much time spent on one alert means not enough time for the other alerts. Time is not your friend when you are either trying to physically track down a system miles away or imaging a hard drive prior to analysis. Why travel miles when milliseconds will do? Why collect terabytes/gigabytes when megabytes will do? Why spend time doing deep dive analysis until you confirm you have to? The answer to all these questions is to walk the delicate balance between thoroughness and speed. To quickly collect only the data you need to confirm if the alert is a security event or false positive. The tools one selects for triage is directly related to their ability to be thorough but fast. One crop of tools to help you strike this balance are triage scripts.
Triage scripts automate parts of the triage process; this may include either the data collection or analysis. The Tr3secure collection script automates the data collection. In my previous post - Tr3Secure Collection Script Updated - I highlighted the new features I added in the script to collect the NTFS Change Journal ($UsnJrnl) and new menu option for only collecting NTFS artifacts. Triaging the alert I described previously can easily be done by leveraging Tr3Secure collection script's new menu option.
To demonstrate this capability I configure a virtual machine in an extremely vulnerable state then visited a few malicious sites to provide me with an end point to respond to.
Responding to the System
The command prompt was accessed on the target system. A drive was mapped to a network share to assist with the data collection. The network share not only is where the collected data will be stored but it is also where the Tr3Secure collect script resides. The command below uses the Tr3Secure collection script NTFS artifacts only option and stores the collected data in the network share with the drive (Y:). Disclaimer: leveraging network shares does pose a risk but it allows for the tools to be executed without being copied to the target and for the data to be stored in a remote location.
The image below shows part of the output from the command above.
The following is the data that was collected using Tr3secure collection script's NTFS artifacts only option:
- Recentfilecach.bcf
- Prefetch files
- Master File Table ($MFT)
- NTFS Change Journal ($UsnJrnl)
- NTFS Logfile ($Logfile)
Triaging
Collecting the data is the first activity in triaging. The next step is to actually examine the data to confirm if the alert is an actual security event or a false positive. The triage process will vary based on what the event is. A fast spreading worm varies from a Trojan. Antivirus alerts vary from malicious network traffic (i.e. an end point communicating with a malicious IP). The scenario demonstrated in this post is for an alert firing that requires triaging an end point. There are certain indicators to look for when triaging end points for malware as outlined below:
- Programs executing from temporary or cache folders
- Programs executing from user profiles (AppData, Roaming, Local, etc)
- Programs executing from C:\ProgramData or All Users profile
- Programs executing from C:\RECYCLER
- Programs stored as Alternate Data Streams (i.e. C:\Windows\System32:svchost.exe)
- Programs with random and unusual file names
- Windows programs located in wrong folders (i.e. C:\Windows\svchost.exe)
- Other activity on the system around suspicious files
In addition to looking for the above indicators, it is necessary to ask yourself a few important questions.
1. What was occurring on the system around the time the alert generated?
2. Is there any indicators in the alert to use examining the data?
3. For any suspicious or identified malicious code, did it execute on the system?
The triage steps to use is dependent on the collected data. In this case, the data collected with NTFS artifacts option results in only examining: program execution and filesystem activity. These two examination steps are very effective for triaging end points as I previously illustrated in my post Triaging Malware Incidents.
Examining Program Execution Artifacts
The first artifact to check is the Recentfilecach.bcf to determine if any stand-alone programs executed on the endpoint. The file can be examined using a hex editor or Harlan's rfc.exe tool included in his WFA 4/e book materials. The command below parses this artifact:
rfc.exe C:\Data-22\WIN-556NOJB2SI8-11.04.14-19.36\preserved-files\AppCompat\RecentFileCache.bcf
The image below is highlighting a suspicious program. The program stands out since it is a program that executed from the lab user profile's temporary internet files folder. Right off the bat this artifact provides some useful information. The coffee.exe program executed within the past 24 hours, the program came from the Internet using the Internet Explorer web browser, and the activity is associated with the lab user profile.
The second program execution artifact collected during the NTFS artifacts only option are prefetch files. The command below parses this artifact with Winprefetchview:
winprefetchview.exe /folder C:\Data-22\WIN-556NOJB2SI8-11.04.14-19.36\preserved-files\Prefetch
The parsed prefetch files were first sorted by process path to find any suspicious programs. Then they were sorted by last run time to identify any suspicious programs that executed recently or around the time of the alert. Nothing really suspicious jumped out in the parsed prefetch files. However, there was a svchost.exe prefetch file and this was examined since it may contain interesting file handles related to the suspicious program listed in the Recentfilecach.bcf. (to see why review my Recentfilecach.bcf post and pay close attention to where I discuss the process svchost.exe) This could be something but it could be nothing. The svchost.exe process had a file handle to the ad[2].htm file located in the temporarily internet files folder as shown below:
Examining Filesystem Artifacts
The Tr3Secure collection script collects the NTFS $MFT, $Logfile, and $UsnJrnl; all of which can provide a wealth of information. These artifacts can be examined in two ways. First is to parse them and then look at the activity around the time the alert fired. Second, is to parse them and then look at the activity around the time of the identified suspicious files appeared on the system. In this post I'm using the latter method since the alert is hypothetical.
The $MFT was parsed with Joakim Schicht's MFT2CSV program. The output format is in the log2timeline format to make it into a timeline.
The MFT2CSV csv file was imported into Excel and a search was performed for the file "coffee.exe". It's important to look at the activity prior to this indicator and afterwards to obtain more context about the event. As illustrated below, there was very little activity - besides Internet activity - around the time the coffee.exe file was created. This may not confirm how the file got there but it does help rule out certain attack avenues such as drive-by downloads.
The image below shows what occurred on the system next. There is activity of Java executing and this may appear to be related to a Java exploit. However, this activity was due to Java update program executing.
The last portion of the $MFT timeline is shown below. A file with the .tmp extension was created in the temp directory followed by the creation of a file named SonicMaster.exe in the System32 folder. SonicMaster.exe automatically becomes suspicious due to its creation time around coffee.exe (guilty by association.) If this is related then that means the malware had administrative rights, which is required to make modifications to the System32 folder. The task manager is executed and then there was no more obvious suspicious activity in the rest of the timeline. The remaining activity was the lab user account browsing the Internet.

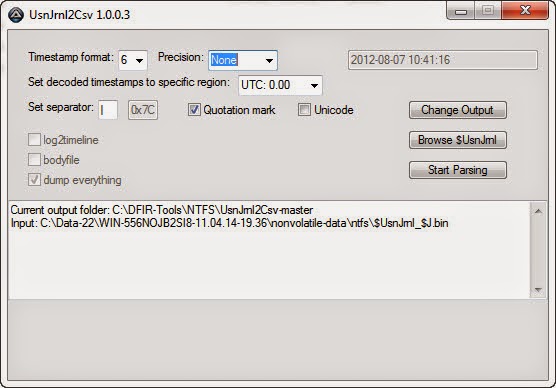
At this point the alert has been properly triaged and confirmed. The event can be escalated according to the incident response procedures. However, addition context can be obtained by parsing the NTFS Change Journal ($UsnJrnl). Collecting this artifact was the most recent update to the Tr3Secure collection script. The $UsnJrnl was parsed with Joakim Schicht's UsnJrnl2CSV program.
The UsnJrnl2CSV csv file was imported into Excel and a search was performed for the file "coffee.exe". It's important to look at the activity prior to this indicator and afterwards to obtain more context about the event. The $UsnJrnl shows the coffee.exe file being dropped onto the system from the Internet (notice the [1] included in the filename.)
The next portion as shown below, shows coffee.exe executing, which resulted in the modification to the Recentfilecache.bcf. Following this the tmp file is created along with the SonicMaster.exe file. The interesting activity is the data overwrites made to the SonicMaster.exe file after it's created.
Immediately after the SonicMaster.exe file creation the data overwrites continued to other programs as illustrated below. To determine what is happening would require those executables to be examined but it appears they had data written to them.
The executables were initially missed in the $MFT timeline since the files by themselves were not suspicious. They were legitimate programs located in their correct folders. However, the parsed $UsnJrnl provided more context about the executables and circling back around to the $MFT timeline shows the activity involving them. Their $MFT entries were updated.
Conclusion
As I mentioned previously, triaging requires a delicate balance between thoroughness but speed. It's a delicate balance between quickly collecting and analyzing data from the systems involved with an alert to determine if the alert is a security event or false positive. This post highlighted an effective technique for triaging an end point and the tools one could use. The entire technique takes minutes to complete from beginning to end. The triage process did not confirm if the activity is a security event but it did determine additional time and resources needs to be spent digging a bit deeper. Doing so would had revealed that the coffee.exe file is malicious and is actually the Win32/Parite file infector. The malware infects all executables on the local drive and network shares. Digging even deeper by performing analysis on coffee.exe (Malwr report and Anubis report) matches the activity identified on the system and even provides more indicators (such as an IP address) one could use to search for other infections in the environment.
Tuesday, June 3, 2014
Posted by
Corey Harrell
Today I gave a presentation titled Malware Root Cause Analysis Don't Be a Bone Head at the New York State Cyber Security Conference. This presentation was a follow-up to the presentation I gave last year titled Finding Malware Like Iron Man. Last year I laid out a triage process to find malware and this year I went into more depth discussing how the malware got there in the first place. This post contains the following for my talk: CFP, slide deck, and video I showed.
CFP
Computer users are confronted with a reoccurring issue every day. This happens regardless if the user is an employee doing work for their company or a person doing online shopping trying to catch the summer sales. The user is using their computer and the next thing you know it is infected with malware. Even Hollywood is not immune to this issue as illustrated in the TV show Bones. The most common action to address a malware infection is to reimage, rebuild, and redeploy the system back into production. Analysis of the system to understand where the malware came from is not a priority or goal.
Root case analysis needs to be performed on systems impacted by malware to improve decision making. The most crucial question to answer is how did this happen since it will determine if we were targeted and more importantly what can be done to mitigate this from re-occurring. Last year, in my presentation Finding Malware Like Iron Man I explored the first step in root cause analysis, which is locating the malware. The next step in root cause analysis is to identify the malware's source.
In this technical presentation Corey will discuss the root cause analysis process to determine how malware infected a computer running the Windows operating system. The topics will include: why perform root cause analysis, how not to perform root cause analysis, compromise root cause analysis model, attack vector artifacts, and scenarios.
Slide Deck
Malware Root Cause Analysis Don't Be a Bone Head slides viewable online
Malware Root Cause Analysis Don't Be a Bone Head slides PDF file
Video
I chopped up the Bones TV episode The Crack in the Code (Season 7 episode 6) I purchased through iTunes. However, others have posted the segment I used in my presentation. For your viewing pleasure here is "Malware on Bone".
Monday, April 21, 2014
Posted by
Corey Harrell
When you look at papers outlining how to build an enterprise-scale incident response process it shows the text book picture about what it should look like. It's not until you start building out the incident response (IR) process and/or responding to security events/incidents when you can truly see what the critical pieces are in the process. In most of the "text book style" IR documentation I've read (for my Masters, enjoyment, and research) they tend to gloss over the triage. Triage is only mentioned as necessary to confirm an indicator and determine if a security event is an incident. Whether if you are building out an IR process or doing internal IR work, triage is not an activity that should be glossed over. In my opinion, it is one of the most important steps. Not only does it need confirm an indicator and determine if a security event is an incident but it also needs to provide guidance to staff for security events that are not incidents. In addition, a good percentage of one's work will be triaging indicators/events to determine what needs to be done - if anything. Seeing how important triage is I dedicated a lot of time to improving and refining techniques to triage security indicators and events. In this post I'm explaining a single technique, which is how the Recentfilecache.bcf file can be used to quickly identify an infected system.
It's All About Triage
I'm not going to disclose my exact triage process nor any other specifics about activities conducted during triaging. However, I will explain the logic behind it to show my thought process and how it was structured. My goal for triage was to find a balance between the amount of resources and time one spends on triaging indicators and alerts. Too much time results in less items being looked at and resources being wasted on trivial things. Not enough time results in items potentially slipping through the cracks. The balance needs to be just enough time spent on triaging an indicator to perform a sufficient analysis so as many indicators/events as possible can be triaged. Lastly, the triage process has to be understandable since I'm teaching others how to do it.
To satisfy these goals I went with a tiered approach to triage. There are different levels in the triage process that does different activities. The lower levels are used to initially look into an indicator. Based on what is learned will determine the next step. Either stop work on the indicator (and update monitoring as needed) or do a more in-depth triage. At the next level the process repeats. Continuing triaging to determine the next steps and take action as necessary. There are four layers in the triage process with the top one being the most in-depth.
Each layer leverages various data and examines that data using various techniques. This way multiple techniques and various data sources are used to provide a more accurate picture. If attempts are made to bypass one technique one of the others will catch it. One technique in one of the layers is the one I'm discussing in this post. Collecting and examining the Recentfilecache.bcf file from a system suspected of being impacted with malicious code to confirm if it is infected and where malware may be located.
Revisiting the RecentFileCache.bcf File
It's probably important to first revisit what the RecentFilecache.bcf file is and why it is important. In my post Revealing the RecentFileCache.bcf File I explained the significance of this file as it relates to digital forensics and incident response. The file records executables that executed on a Windows 7 system and the relevance of the listed executables mean the following:
1. The program is probably new to the system.
2. The program executed on the system.
3. The program executed on the system some time after the ProgramDataUpdater task was last ran.
A good percentage of the time when a machine is compromised with malicious code an executable is initially created on the system and executed. This is how both downloaders and droppers typically work and why both of these tools end up listed in the RecentFileCache.bcf file. So when you are looking into an malicious code indicator checking this artifact is a fast way to determine if a new executable was created and executed on the system. I've been using this technique for some time and it is very effective in confirming a system infected with malware that occurred fairly recently (within last 24 hours or since the ProgramDataUpdater task last ran).
Still Digesting Harlan Carvey's Latest Work
If you haven't noticed Harlan Carvey has released some new things for the community. There is the new RegRipper package which includes a bunch of new plug-ins. His new book Windows Forensic Analysis Toolkit: Advanced Analysis Techniques for Windows 8 was published and he released the book materials online. Needless to say I'm still digesting all of this. However, I wanted to take a look at what is new. After reading the RegRipper update file to see the new plug-ins I went through his book archive. That's when I saw one of the tools in the Chapter 4 folder named rfc.exe. To see what the tool does you can read the Perl source code (wfa4e\ch4\source rfc.pl) but I'll say what the tool does. It parses the RecentFileCache.bcf file.
Until now, there are not many (if any) tools that parse this file. You can read the programs listed in this artifact with a hex editor but doing so takes time. Using a parser is faster since all you need to do is execute one command to see the listed programs. For example, running the rfc.exe tool against a Recentfilecache.bcf file from a machine recently infected shows the following:
rfc.exe G:\Windows\AppCompat\Programs\RecentFilecache.bcf
c:\windows\system32\schtasks.exe
c:\program files\common files\java\java update\jusched.exe
c:\users\lab\appdata\local\microsoft\windows\temporary internet files\content.ie5\i87xk24w\n6up2014[1].com
c:\program files\common files\java\java update\jucheck.exe
I highlighted the one suspicious file; the com file that executed from a user profile's temporary internet files folder. As you can see, rfc.exe makes a quick way to locate malware even quicker.
Triaging with RecentFileCache.bcf File and rfc.exe
As I demonstrated, combining the RecentFileCache.bcf file with Harlan's rfc.exe (or rfc.pl) tool is a quick way to locate malware. This technique is excellent for use in triage to determine if a system is infected. All that needs to be done is to access or collect the RecentFileCache.bcf file then parse it to see what is listed in it.
Another useful thing to know about the RecentFileCache.bcf file is it is not a locked file. This means the file can be accessed, collected, and parsed without another tool to unlock it. If you are triaging an indicator on a live system all you need to do is run the following command:
E:\DFIR-Tools\rfc.exe C:\Windows\AppCompat\Programs\RecentFileCache.bcf
The command will work but who wants to interact with the live system through its keyboard. This requires finding the system, walking to the system, explaining things to a person, and then triaging the system. It's not a fast method. The better approach is to do your triage remotely against the system. It works regardless if the system is on a different floor or in a different city. This is made even easier if the environment you are in has Windows administrative shares. These shares "are hidden network shares created by Windows NT family of operating systems that allow system administrators to have remote access to every disk volume on a network-connected system." You can access them by typing in the full UNC path in Windows Explorer or the Run dialog box. This will bring up the remote system's volume in Windows Explorer which is a GUI and not a fast method. The faster method is to access the remote system's volume by creating a mapped network drive to it. After the drive is mapped you can either parse the RecentFileCache.bcf file directly or copy the file to your analysis machine for offline parsing. Let's walk through how to do this.
The command below maps the remote C volume to the drive letter R and the mapped drive is not persistent.
net use R: \\192.168.1.1\c$ /PERSISTENT:NO
The command below parses the RecentFileCache.bcf file remotely.
C:\DFIR-Tools\rfc.exe R:\Windows\AppCompat\Programs\RecentFileCache.bcf
The command below is to collect the file for offline parsing (the asterisk tells xcopy the object is a file and the /h switch is to copy system and hidden files)
xcopy R:\Windows\AppCompat\Programs\RecentFileCache.bcf C:\Collection\RecentFileCache.bcf* /h
After the RecentFileCache.bcf is either parsed or copied then the drive letter to the remote C volume can be deleted with the following command:
net use R: /delete /y
If you have access to Encase Enterprise (or Encase Forensic with F-response) and prefer to stay within Encase then use Lance's RecentFileCache.bcf enscript.
Wrapping Things Up
What I illustrated is the basic technique for leveraging the Recentfilecache.bcf file to quickly confirm if a system is infected and where malware may be located. The technique is even faster by automating it in a script. As you might have guessed, I use this technique remotely across the enterprise when triaging indicators. It can be a standalone technique but I don't use it as such. It's just one technique out of many I incorporated into my layered triage process. Hopefully, people find this useful and it provides a little more context to my tweet last week.
Sunday, March 23, 2014
Posted by
Corey Harrell
The Application Experience and Compatibility feature ensures compatibility of existing software between different versions of the Windows operating system. The implementation of this feature results in some interesting program execution artifacts that are relevant to Digital Forensic and Incident Response (DFIR). I spent a lot of time talking about these artifacts in my posts: Revealing the RecentFileCache.bcf File, Revealing Program Compatibility Assistant HKCU AppCompatFlags Registry Keys, and Exploring Windows Error Reporting. In this short post I'm discussing another source containing program execution information, which is the Application-Experience Program Inventory Event Log.
Where Is the Program Inventory Event Log
Similar to the other event logs on a Windows system, the program inventory event log (Microsoft-Windows-Application-Experience%4Program-Inventory.evtx) is located in the C:\Windows\System32\winevt\Logs folder as shown below.
In the Windows event viewer the log can be found at: Applications and Services Logs\Microsoft\Application-Experience\Program-Inventory as shown below.
Program Inventory Event Log Relevance to DFIR
The DFIR relevance of the events recorded in this log has been mentioned by others. The Cylance Blog briefly mentions it in their post Uncommon Event Log Analysis for Incident Response and Forensic Investigations. The NSA document Spotting the Adversary with Windows Event Log Monitoring references the log in the Recommended Events to Collect section (pg 27). The document outlined the following event IDs: 800 (summary of software activities), 903 & 904 (new application installation), 905 & 906 (updated application), and 907 & 908 (removed application). Harlan provides more context on how the events in this log can be useful in his post HowTo: Determine Program Execution. He shared how he used this log to determine an intruder installed a tool on a compromised system. Now let's take a closer look at these event IDs to see what information they contain.
Event ID 800 (summary of software activities)
Event IDs 900 & 901 (new Internet Explorer add-on)
Event IDs 903 & 904 (new application installation)
Event ID 905 (updated application)
Event IDS 907 & 908 (removed application).
Monday, February 24, 2014
Posted by
Corey Harrell
The Application Experience and Compatibility feature ensures compatibility of existing software between different versions of the Windows operating system. The implementation of this feature results in some interesting program execution artifacts that are relevant to Digital Forensic and Incident Response (DFIR). I already highlighted a few of these in my posts Revealing the RecentFileCache.bcf File and Revealing Program Compatibility Assistant HKCU AppCompatFlags Registry Keys. There are more artifacts associated with this feature and the Windows Error Reporting (WER) are one of them. Over the past few months WER has been discussed frequently due to the potential data it exposes when data is sent to Microsoft. However, WER can be a useful program execution artifact for incident response since malicious code - such as malware and exploited applications - can crash on systems. This short post provides discusses WER and illustrates how it is helpful to track malware on a system.
What is Windows Error Reporting
Windows Error Reporting is basically a feature to help solve problems associated with programs crashing on the Windows operating system. The Windows Internals, Part 1: Covering Windows Server 2008 R2 and Windows 7 goes into more detail by stating:
"WER is a sophisticated mechanism that automates the submission of both user-mode process crashes as well as kernel-mode system crashes."
The service analyzes the crashed application's state and builds context information surrounding the crashed program. The book continues by saying:
On default configured systems, an error report (a minidump and XML file with various details, such as the DLL version numbers loaded in the process) is sent to Microsoft's online crash analysis server. Eventually, as the service is notified of a solution for a problem, it will display a tooltip to the user informing her of steps that should be taken to solve the problem.
How Does Windows Error Reporting Work?
There are two registry keys responsible for WER's configuration. These keys are listed below; the first key affects system-wide behavior while the second is user specific.
HKEY_LOCAL_MACHINE\Software\Microsoft\Windows\Windows Error Reporting
HKEY_CURRENT_USER\Software\Microsoft\Windows\Windows Error Reporting
The best resource I found explaining how WER works is a paper written by 0xdabbad00. Their paper is titled Notes on Windows Error Reporting and the actual PDF can be found here. The paper "attempts to better explain what is and is not possible and to generalize the attack classes for all error reporting" and touches on the following key points:
- What traffic is sent unencrypted and what is sent encrypted
- What data is in the unencrypted traffic
I won't try to rehash what is written in the paper since it really goes into great detail. Anyone who wants to know more about WER should read this.
What Artifacts Are Left By Windows Error Reporting?
One item I really liked about the Notes on Windows Error Reporting paper is its Appendix. The focus of the paper is on explaining the WER feature but the Appendix provides some useful DFIR tidbits about the WER artifacts present on the system. These artifacts are important because they show a program was running on the system and it eventually crashed. In the past, WER artifacts have given me more context about the other program execution artifacts located on a system. The WER artifacts outlined in the Appendix include: event logs, WER folder, AppCompat.txt file, and WERInternalMetadata.xml file.
WER records an entry in the event log when a crashed application is analyzed and then another event log entry is recorded if information is sent to Microsoft. The Appendix shows what this event log looks like including the information it contains. The event log also shows that the WER folder is located at C:\Users\username\AppData\Local\Microsoft\Windows\WER.
The paper also explains what the AppCompat.txt and WERInternalMetadata.xml files are while the Appendix shows the information stored in these files. Either one of the files provide a wealth of information about the program that crashed such as the parent process, parent process command line, and process path.
Additional about Windows Error Reports
I wanted to provide additional information about one WER artifact mentioned in the paper. Specifically, the actual Windows Error Report themselves. A Windows Error Report records a ton of information about a program that was running at some point in the past. To illustrate I'll walk through a WER for a piece of malware that crashed on a system. The screenshot below shows the beginning of a report and some of the information shown is when the program crashed and program was 32-bit (notice the WOW64).
The next portion of the report starts to provide information about the crashed program.
A little bit further down in the report you can see part of the user interface message as shown below.
The report even recorded the program's loaded modules at the time of the crash. This section contains the file path to the crashed application and in this instance the program is highly suspicious (executable launching from a temp folder).
The end of the report contains the last piece of useful information about the crash.
A search on the AppName in the Malware Analysis Search provides some leads about what malware was present on the system. It leads to VirusTotal reports and sandbox reports showing malware crashing such as this one.
WER's Relevance
WER provides more artifacts that show program execution. Overall this artifact is not as beneficial as the other program execution artifacts but once in a while malicious code will crash or cause an application to crash. When this occurs WER provides more context about what occurred on the system and the relevance of the executable listed means the following:
1. The program executed on the system.
2. The program crashed on the system.
3. The data in the WER artifacts is information about the program at the time it was running and crashed on the system.
Tuesday, January 14, 2014
Posted by
Corey Harrell
Computer users are confronted with a reoccurring issue every day. This happens regardless if the user is an employee doing work for their company or a person doing online shopping trying to catch the holiday sales. The user is using their computer and the next thing they know it is infected with malware. Then someone gets tasked with resolving the malware issue and one of the first things they need to do is to find the malware. This is a common occurrence that plays out every day to anyone who either uses a computer or is responsible for protecting a network. How the malware gets found depends on the person. Some fire off antivirus scanners, others examine memory, some follow a documented process, and others are not sure where to start. I've talked about my detailed process numerous times and I even shared one of my triage techniques last year. Regardless of the process used, there is one examination step that stands above the rest in locating malware on a system. This step is examining the program execution artifacts.
What Malware Indicators to Look For
As the name implies program execution artifacts show what programs executed on a system and at times what programs were present on the system. The significance of knowing what programs ran can be seen in my corollary to the Rootkit Paradox:
1. They need to run
2. They want to remain hidden
Malware wants to remain hidden on a system so it can accomplish what it was designed to do. However, in order for malware to hide on a system a program has to run. This program executes to either hide itself or another piece of malware; in the process it will leave artifacts on the system. These artifacts - program execution artifacts - can be used to find where the malware is hidden. Below are the malware indicators to look for as the program execution artifacts are reviewed (my post Triaging Malware Incidents shows how to use these indicators for triaging).
- Programs executing from temporary or cache folders
- Programs executing from user profiles (AppData, Roaming, Local, etc)
- Programs executing from C:\ProgramData or All Users profile
- Programs executing from C:\RECYCLER
- Programs stored as Alternate Data Streams (i.e. C:\Windows\System32:svchost.exe)
- Programs with random and unusual file names
- Windows programs located in wrong folders (i.e. C:\Windows\svchost.exe)
- Other activity on the system around suspicious files
Program Execution Artifacts
Program execution artifacts have been well documented over the years. For example, Harlan put together a post explaining how to determine what programs executed on a system. The key to finding malware is to look for the above indicators in the program execution artifacts and to review all of the artifacts since each one provides different information. To illustrate why the reviewing program execution artifacts examination step stands above the rest I'll walk through the step against a system I infected with malware.
Parsing Program Execution Artifacts
The purpose of this post is to show how just the program execution artifacts can reveal malware on a system as opposed to the tools one should use. However, for completeness I'm sharing the tools I use to parse these artifacts. I use the autorip script along with RegRipper to parse the majority of the artifacts and Nirsoft Winprefetchview to parse the prefetch files.
RecentFileCache.bcf File
The first artifact to review on Windows 7 systems is the recentfilecach.bcf file. This file shows programs that executed on a system and the majority of the time these programs are new to the system. The programs listed here executed recently; within the last 24 hours or when the ProgramDataUpdater task last ran. The RecentFileCache.bcf on my test system showed the following:
c:\program files\common files\java\java update\jusched.exe
c:\users\lab\appdata\local\microsoft\windows\temporary internet files\content.ie5\i87xk24w\n6up2014[1].com
c:\program files\common files\java\java update\jucheck.exe
The one program that stands out is the n6up2014[1].com program since it's located in the temporary Internet files folder.
Prefetch Files
The next artifact to review to identify malware quickly on a system are the Windows prefetch files. Prefetch files show a wealth of information: program's file path, last run time, run count, and files accessed during start-up. Furthermore, the prefetch file's creation date can indicate when the program first ran. Sorting the parsed prefetch files on my test system by the program's file path makes it easier to spot malware. The image below illustrates this.
Similar to the RecentFileCache.bcf, the first malware indication is a randomly named program (n6up2014[1].com) executing from a temporary folder in a user profile. The n6up2014[1].com prefetch file also provides the time of interest to help locate other malware which is 01/10/14 00:38:25 UTC. Prefetch files contain references to the files accessed during start-up and these references can point to other malware. The image below highlights the winupdates.exe program referenced in the n6up2014[1].com prefetch file.

The winupdates.exe program is suspicious since it's a program that executed from the users profile. Also, the winupdates.exe zone.identifier alternate data stream indicates the program was downloaded from a different security zone (the Internet). Furthermore, the program executed around the same time as the n6up2014[1].com program. Sorting prefetch files by last modification is a fast and simple method to find other malware on the system. The image below shows the prefetch files sorted by last modification time.
The image above didn't highlight any other potential malware but it does reveal the netsh.exe program executed around the same time as the malware. netsh.exe is a program to "administrator can use to configure and monitor Windows-based computers at a command prompt."
AppCompatCache Registry Key
The next artifact to review to identify malware on a system is the AppCompatCache registry key located in the System hive. Mandiant highlighted the significance of this artifact in their article "Leveraging the Application Compatibility Cache in Forensic Investigations." This article not only shows executables that executed on the system but it also shows executables which were present on the system. The AppCompatCache key from my test system also showed the same suspicious programs with malware indicators.
UserAssist Registry Key
Continuing on with the examination the next artifact to review is the userassist registry key located in the user account's NTUSER.DAT hive. This registry key sheds light on "what programs the user has launched via the Explorer shell." The image below shows the portion of the userassist registry key for the user account where the suspicious programs were located and the timeframe of when they executed.
As can be seen, the image doesn't reveal other malware but it does show the user executed their web browser prior to the infection. This information about the potential source of the malware isn't a surprise since the n6up2014[1].com file was located in the temporary Internet files folder and the winupdates.exe had a zone.identifier alternate data stream.
MUICache Registry Key
Continuing on with the examination is reviewing the muicache registry key located in the user account's NTUSER.DAT (for Windows XP) or UsrClass.dat (for Windows 7) hive. The muicache shows programs that ran under the context of the user account and is another area to look for malware indicators. The muicache from my test system didn't reveal any useful information as shown below.
AppCompatFlags Registry Key
The search for malware indicators should continue by reviewing the AppCompatFlags registry key. This artifact contains information about program execution and is more relevant for Windows 8 systems compared to Windows 7. This registry key hasn't been created on my Windows 7 test system as shown below.
Tracing Registry Key
It may be tempting to stop the examination and follow up on the programs already identified but doing so may result in overlooking other malware. The next artifact to review is the tracing registry key located in the System hive. This key may contain program execution for programs with networking capabilities. The tracing registry key from my test system didn't reveal any useful information as shown below.
Legacy Registry Keys
The last program execution artifact to review is the legacy registry keys located in the System hive. These keys can be helpful to locate malware which installs itself as a Windows service. The legacy registry keys from my test system didn't reveal any useful information as shown below (notice the lack of entries for my timeframe of interest).
Wrapping Things Up
Solely focusing on examining the program execution artifacts identified malware on the test system. Specifically, the following malware was identified:
C:\Users\lab\AppData\Local\Microsoft\Windows\Temporary Internet Files\Content.IE5\I87XK24W\n6up2014[1].com
C:\Users\lab\AppData\Roaming\winupdates.exe
In addition to locating malware it was also determined the netsh.exe program executed around the same time as the infection. The activity identified in the program execution artifacts matches the activity observed when analyzing the n6up2014[1].com program. n6up2014[1].com creates on the system and executes the winupdates.exe program while netsh.exe is used to modify the Windows firewall.
Knowing the information discovered by reviewing program execution artifacts will empower anyone who is tasked with resolving a malware issue. This is the same technique I have been using for years to find malware on systems extremely fast. Normally I can find malware in minutes; in less than 10 minutes. This is why I stand by my comment examining program execution artifacts stands above the rest of the examination steps in locating malware on a system. This is why my response to anyone asking for help in locating malware is to start by examining the program execution artifacts.
 Adam provided some great information; to narrow in on the dllhost.exe process and what strings to look for. Another response I got was from @lstaPee as shown below: