Reviewing Timelines with Calc
Monday, November 22, 2010
3
comments
At one point I could have been considered a blog stalker. By this I mean I would follow and read numerous blogs without ever providing feedback to the author. I wouldn't contact them offline and I wouldn’t leave a comment on their blogs. The only indication of my presence would appear in the website’s statics as a unique visitor on a certain day. During my stalking days I didn't realize how valuable feedback was to an author about the information they are sharing. I also didn't realize how comments on a blog post could help start discussions or help point to other areas of further research and testing.
I mention this because an anonymous reader asked a question to my post Reviewing Timelines with Excel. The reader wanted to know if Calc (spreadsheet program in the OpenOffice suite) could be used to review timelines similar to Excel. I didn't know the answer to this question since I 'm not that familiar with Calc. However, it was a great question and I wondered how Calc compares to Excel as a tool for reviewing timelines. The purpose of this post is to compare the functionality of Calc against Excel as it relates to reviewing timelines.
The first thing I needed to know before I spent the time testing Calc was the maximum number of rows supported by the program. The maximum number of rows for a spreadsheet program is important for reviewing timelines because all of the timeline data has to included. I didn't want to waste my time testing Calc if it couldn't handle the potential large datasets created by timelines. For example, the timeline I'm using in this post was from a Windows XP SP3 virtual machine that only had Adobe Reader and Java installed. This timeline still had over 100,000 rows. Excel started supporting over a million rows with the release of Excel 2007 (prior versions of Excel only supported about 65,000 rows). The latest version of Calc at the time of this post was version 3.2.1 and this version only supports about 65,000 rows. I attempted to load a timeline into Calc v3.2.1 and the data was truncated to 65,000 rows resulting in half of my data being lost. However, OpenOffice version 3.3.0 is available for download and this version supports over a million rows. (I tested OpenOffice v3.3 Release Candidate 4)
The comparison can be made between Calc and Excel since Calc can handle the large datasets involved with timelines. Calc will be compared to Excel using the different functionality I covered in the post Reviewing Timelines with Excel. The following are the four areas being compared:
* Importing Data
* Filters
* Advanced Filters
* Find
Side note: I will be using the timeline from the post How Did the System Become Infected Part 2. The keywords I will be using are aaclientt.exe and 75622830.exe since these were two rogue processes identified running on the system. The Excel pictures I'm using as a comparison are from the Reviewing Timelines with Excel post.
Significant Differences
I noticed two significant differences between Calc and Excel 2007 (besides Calc being free while Excel costs money). The first difference was Calc’s ability to support regular expressions in the filter and find functionality. Regular expressions enable you to create more powerful filters or searches. Excel 2007 supports the usage of two symbols in variables when applying a filter or performing a search. The symbols supported are the question mark (?) to represent any single character and the asterisk (*) to represent any series of characters. It appears Excel can support regular expressions using macros but this isn't an option for me (I would prefer to learn Perl or Enscripting instead of Visual Basic which would be needed to write a macro). The help file in Calc outlines all of the expressions supported but the image below shows the first four regular expressions listed in the help file.

The second difference is Calc supports three types of filters while Excel 2007 only supports two filters (filters and advanced filters). The picture below shows the three types of Calc filters.

Importing Data
Timelines in csv files can be opened directly using a spreadsheet program. However, I have had issues with trying to add edits to timelines by directly opening the csv file in Excel. As a result, I started importing the csv file as a comma delimited file. I haven't fully tested Calc so I don't know if the same issue would be encountered but I wanted to compare how Calc imports a csv file. The process in Calc to import a text file as a comma delimited file is very similar to performing the function is Excel. There are only a few slight differences between the two programs as I’ll demonstrate.
To import a csv file select Insert > Sheet From File as shown below.

An Insert window will appear with a browse option which lets you locate and select the file to be imported. Calc will automatically detect the file as a text file and will display the Text Import window. The picture below highlights the options to import the timeline csv file as a comma delimited file. Once the options are selected then OK can be clicked in order to import the data.

For a comparison I included the image of Excel importing a csv timeline as a comma delimited file.

Autofilters
I think the autofilter filter is not useful for reviewing timelines. Autofilter only lets you select a variable from an automatically generated list and there isn't an option to type in your own variable. This is why I think the standard and advanced filters are better choices when working with timelines. I'm still briefly discussing the autofilter functionality in order for the comparison between Calc and Excel to be complete.
To activate the autofilter filter select Data > Filter > Autofilter. A dialog will appear stating there isn't a column header and the first line can be used as the header.

Drop down arrows will appear in the first row when the autofilter is activated as shown below.

To apply a filter, the drop down arrow has to be used in the column the filter is being applied to. To test the functionality I applied a filter to the File Name column. The picture below shows the automatically generated values that can be used in the filter.

Notice in the picture above that the entire data in the File Name column has to be used for the filter. I think this isn't feasible for reviewing timelines because it will only show the rows with that exact value. I usually want to apply filters using keywords since this will show me all of the rows containing the variable. For example, selecting the value HKCU-Administrator only shows the rows containing that exact value as shown below (notice the slight change in the drop down menu indicating a filter is applied).

To remove the filter select Data > Filter > Remove Filter.

The picture below shows autofilter icon being shaded indicating the filter is turned on. To deactivate the autofilter select Data > Filter > Autofilter.

Standard Filter
Calc's standard filter is the equivalent of Excel's regular filter. However, Calc has the ability to filter on eight different variables combining them with or/and operations while Excel only supports filtering on two variables. As I stated previously, Calc also has the ability to support regular expressions in filters. I think the combination of regular expressions and eight different variables makes Calc a viable alternate to Excel's filter functionality including Excel’s advanced filters using less than eight variables. Accessing the standard filter option (select Data > Filter > Standard Filter) brings up the Standard Filter window as shown below.

A standard filter has three parts which are field name (column to filter on), condition, and value (variable). To demonstrate functionality of a standard filter I will apply a filter for aaclient to the file name column. To select the file name column use the drop down arrow in the Field Name box as shown below.

The condition I'm using is the contains option since it will show all of the rows containing the variable aaclient. The picture below shows the various conditions that could be used in filters.

Lastly, the variable aaclient has to be typed into the Value box. The filter I'm applying to the timeline only has one variable but Operator’s drop down menu enables up to eight variables to be included in a filter. The picture below shows the two operations available.

At this point this point the filter is configured and can be applied by pressing the OK button. The picture below shows a portion of the timeline with this filter applied.

The filter I demonstrated was pretty basic so it didn't show all of options available in standard filters. These options can be accessed by using the More Options button located in the bottom left of the Standard Filter window. The picture below shows the additional options (note: the regular expressions option needs to be selected in order to use regular expressions).

As I mentioned previously, Calc's standard filter is the equivalent of Excel's regular filter but Calc has additional options. The Calc Standard Filter window above can be compared to Excel's Custom Autofilter window below in order to see the differences between the two programs.

Advanced Filter
Calc's advanced filter is the equivalent of Excel's advanced filter. With the exception of Calc supporting regular expressions, the advanced filter functionality between both programs is very similar. Just like Excel, a database has to be setup in a worksheet in order to use advanced filters. The top row with the column names can be copied and pasted into an area of the worksheet not containing timeline data. The picture below shows I setup the database two rows below the timeline data.

The advanced filters in Calc work the same way as Excel. The variable(s) is placed under the column(s) to be filtered on and variables can be combined using the and/or operations. The and operation is when both variables are on the same row while the or operation is when the variables are on different rows.
Side note: To apply an advanced filter using the contains condition requires the symbols for any series of characters to enclose the variable. In Excel the asterisk (*) symbol was used and the final variable looks like *this*. In Calc two symbols have to be used to accomplish this. The first symbol is the period (.) since it represents any character while the second symbol is the asterisk (*) since it finds zero or more characters of what is preceding the asterisk. The final variable looks like .*this.*
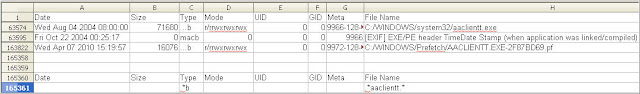
Applying a filter is similar to Excel. Variable(s) are placed under the desired column then any cell containing timeline data is selected followed by selecting the advanced filter (Data > Filter > Advanced Filter). The picture below shows the Advanced Filter window containing a filter. This filter will only display rows containing a newly created file and the word aaclientt.

In the Advanced Filter window above, notice the filter criteria matches the filter in the database (A165360:H165361). The filter contains regular expressions so the regular expressions option must be selected using the More button. The picture below shows the option being selected.

The filter can be applied once the filter criteria is verified and all desired options are selected. The picture below shows the timeline data with the filter applied.
To continue demonstrating the similarity between Calc and Excel's advanced filters I'll show the timeline data with two filters applied. The picture below is the timeline data with a filter containing an and statement applied (I included the advanced filter window so the filter criteria can be seen).

The picture below is the timeline data with a filter containing an or statement applied (again the advanced filter window was included in the screenshot).

Find
Calc supports the ability to find the next instance of a variable or to find all instances of a variable. The find next option in Calc is very similar to Excel but the find all option in Calc doesn't provide you with a quick method for reviewing all of the rows with the variable(s) like Excel. I will first demonstrate the find next functionality then I will demonstrate the find all functionality. To access Calc’s find and replace functionality you can use CTRL + F, select Edit > Find & Replace, or click the find and replace icon (binoculars image) as shown below.

The picture below shows the options available in the Find and Replace window. Similar to the filters, the regular expression option must be selected if the variable contains regular expressions. The Find button is used to find the next instance of the variable while the Find All button will find all instances of the variable in the timeline.

The picture below shows how Calc finds the next instance of the variable aaclient.

The similarities between Calc and Excel can be seen by comparing the picture above with the below picture of Excel’s find next window.

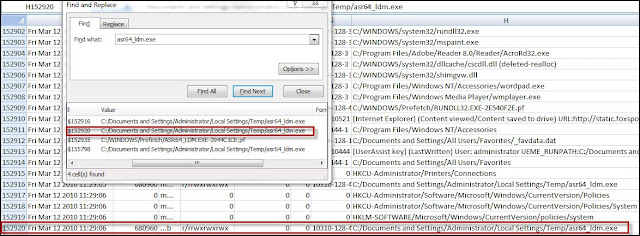
Using the same variable, I selected the Find All button to demonstrate this functionality. The only visible difference with using find all is the background color of the box containing the variable changes.

You have to browse the timeline in order to find the other instances of the variable. I think this is a significant difference compared to Excel because the manual browsing makes it more challenging when working with a large dataset since a row could be overlooked. The picture below shows two other rows containing the variable aaclient.

Calc’s find all functionality is the one area I felt was lacking when compared to Excel. Excel provides a way to quickly locate all of the instances which makes examining the timeline faster and more efficient. The picture below shows how Excel provides this ability to quickly locate rows containing the variable being searched for.
Conclusion
Every tool has its advantages and disadvantages. In one instance a tool may better suit your needs while in a different situation another tool may be the better option. Calc is just another tool that can be used to review timelines and it will have a place in my toolbox.
I wanted to thank the anonymous reader for posting their comment. Not only did I find the comparison of Calc and Excel to be interesting but I also learned how to review timelines with the program.
I mention this because an anonymous reader asked a question to my post Reviewing Timelines with Excel. The reader wanted to know if Calc (spreadsheet program in the OpenOffice suite) could be used to review timelines similar to Excel. I didn't know the answer to this question since I 'm not that familiar with Calc. However, it was a great question and I wondered how Calc compares to Excel as a tool for reviewing timelines. The purpose of this post is to compare the functionality of Calc against Excel as it relates to reviewing timelines.
The first thing I needed to know before I spent the time testing Calc was the maximum number of rows supported by the program. The maximum number of rows for a spreadsheet program is important for reviewing timelines because all of the timeline data has to included. I didn't want to waste my time testing Calc if it couldn't handle the potential large datasets created by timelines. For example, the timeline I'm using in this post was from a Windows XP SP3 virtual machine that only had Adobe Reader and Java installed. This timeline still had over 100,000 rows. Excel started supporting over a million rows with the release of Excel 2007 (prior versions of Excel only supported about 65,000 rows). The latest version of Calc at the time of this post was version 3.2.1 and this version only supports about 65,000 rows. I attempted to load a timeline into Calc v3.2.1 and the data was truncated to 65,000 rows resulting in half of my data being lost. However, OpenOffice version 3.3.0 is available for download and this version supports over a million rows. (I tested OpenOffice v3.3 Release Candidate 4)
The comparison can be made between Calc and Excel since Calc can handle the large datasets involved with timelines. Calc will be compared to Excel using the different functionality I covered in the post Reviewing Timelines with Excel. The following are the four areas being compared:
* Importing Data
* Filters
* Advanced Filters
* Find
Side note: I will be using the timeline from the post How Did the System Become Infected Part 2. The keywords I will be using are aaclientt.exe and 75622830.exe since these were two rogue processes identified running on the system. The Excel pictures I'm using as a comparison are from the Reviewing Timelines with Excel post.
Significant Differences
I noticed two significant differences between Calc and Excel 2007 (besides Calc being free while Excel costs money). The first difference was Calc’s ability to support regular expressions in the filter and find functionality. Regular expressions enable you to create more powerful filters or searches. Excel 2007 supports the usage of two symbols in variables when applying a filter or performing a search. The symbols supported are the question mark (?) to represent any single character and the asterisk (*) to represent any series of characters. It appears Excel can support regular expressions using macros but this isn't an option for me (I would prefer to learn Perl or Enscripting instead of Visual Basic which would be needed to write a macro). The help file in Calc outlines all of the expressions supported but the image below shows the first four regular expressions listed in the help file.

The second difference is Calc supports three types of filters while Excel 2007 only supports two filters (filters and advanced filters). The picture below shows the three types of Calc filters.

Importing Data
Timelines in csv files can be opened directly using a spreadsheet program. However, I have had issues with trying to add edits to timelines by directly opening the csv file in Excel. As a result, I started importing the csv file as a comma delimited file. I haven't fully tested Calc so I don't know if the same issue would be encountered but I wanted to compare how Calc imports a csv file. The process in Calc to import a text file as a comma delimited file is very similar to performing the function is Excel. There are only a few slight differences between the two programs as I’ll demonstrate.
To import a csv file select Insert > Sheet From File as shown below.

An Insert window will appear with a browse option which lets you locate and select the file to be imported. Calc will automatically detect the file as a text file and will display the Text Import window. The picture below highlights the options to import the timeline csv file as a comma delimited file. Once the options are selected then OK can be clicked in order to import the data.
For a comparison I included the image of Excel importing a csv timeline as a comma delimited file.
Autofilters
I think the autofilter filter is not useful for reviewing timelines. Autofilter only lets you select a variable from an automatically generated list and there isn't an option to type in your own variable. This is why I think the standard and advanced filters are better choices when working with timelines. I'm still briefly discussing the autofilter functionality in order for the comparison between Calc and Excel to be complete.
To activate the autofilter filter select Data > Filter > Autofilter. A dialog will appear stating there isn't a column header and the first line can be used as the header.

Drop down arrows will appear in the first row when the autofilter is activated as shown below.
To apply a filter, the drop down arrow has to be used in the column the filter is being applied to. To test the functionality I applied a filter to the File Name column. The picture below shows the automatically generated values that can be used in the filter.

Notice in the picture above that the entire data in the File Name column has to be used for the filter. I think this isn't feasible for reviewing timelines because it will only show the rows with that exact value. I usually want to apply filters using keywords since this will show me all of the rows containing the variable. For example, selecting the value HKCU-Administrator only shows the rows containing that exact value as shown below (notice the slight change in the drop down menu indicating a filter is applied).
To remove the filter select Data > Filter > Remove Filter.

The picture below shows autofilter icon being shaded indicating the filter is turned on. To deactivate the autofilter select Data > Filter > Autofilter.

Standard Filter
Calc's standard filter is the equivalent of Excel's regular filter. However, Calc has the ability to filter on eight different variables combining them with or/and operations while Excel only supports filtering on two variables. As I stated previously, Calc also has the ability to support regular expressions in filters. I think the combination of regular expressions and eight different variables makes Calc a viable alternate to Excel's filter functionality including Excel’s advanced filters using less than eight variables. Accessing the standard filter option (select Data > Filter > Standard Filter) brings up the Standard Filter window as shown below.

A standard filter has three parts which are field name (column to filter on), condition, and value (variable). To demonstrate functionality of a standard filter I will apply a filter for aaclient to the file name column. To select the file name column use the drop down arrow in the Field Name box as shown below.

The condition I'm using is the contains option since it will show all of the rows containing the variable aaclient. The picture below shows the various conditions that could be used in filters.

Lastly, the variable aaclient has to be typed into the Value box. The filter I'm applying to the timeline only has one variable but Operator’s drop down menu enables up to eight variables to be included in a filter. The picture below shows the two operations available.

At this point this point the filter is configured and can be applied by pressing the OK button. The picture below shows a portion of the timeline with this filter applied.

The filter I demonstrated was pretty basic so it didn't show all of options available in standard filters. These options can be accessed by using the More Options button located in the bottom left of the Standard Filter window. The picture below shows the additional options (note: the regular expressions option needs to be selected in order to use regular expressions).

As I mentioned previously, Calc's standard filter is the equivalent of Excel's regular filter but Calc has additional options. The Calc Standard Filter window above can be compared to Excel's Custom Autofilter window below in order to see the differences between the two programs.

Advanced Filter
Calc's advanced filter is the equivalent of Excel's advanced filter. With the exception of Calc supporting regular expressions, the advanced filter functionality between both programs is very similar. Just like Excel, a database has to be setup in a worksheet in order to use advanced filters. The top row with the column names can be copied and pasted into an area of the worksheet not containing timeline data. The picture below shows I setup the database two rows below the timeline data.

The advanced filters in Calc work the same way as Excel. The variable(s) is placed under the column(s) to be filtered on and variables can be combined using the and/or operations. The and operation is when both variables are on the same row while the or operation is when the variables are on different rows.
Side note: To apply an advanced filter using the contains condition requires the symbols for any series of characters to enclose the variable. In Excel the asterisk (*) symbol was used and the final variable looks like *this*. In Calc two symbols have to be used to accomplish this. The first symbol is the period (.) since it represents any character while the second symbol is the asterisk (*) since it finds zero or more characters of what is preceding the asterisk. The final variable looks like .*this.*
Applying a filter is similar to Excel. Variable(s) are placed under the desired column then any cell containing timeline data is selected followed by selecting the advanced filter (Data > Filter > Advanced Filter). The picture below shows the Advanced Filter window containing a filter. This filter will only display rows containing a newly created file and the word aaclientt.

In the Advanced Filter window above, notice the filter criteria matches the filter in the database (A165360:H165361). The filter contains regular expressions so the regular expressions option must be selected using the More button. The picture below shows the option being selected.

The filter can be applied once the filter criteria is verified and all desired options are selected. The picture below shows the timeline data with the filter applied.

To continue demonstrating the similarity between Calc and Excel's advanced filters I'll show the timeline data with two filters applied. The picture below is the timeline data with a filter containing an and statement applied (I included the advanced filter window so the filter criteria can be seen).

The picture below is the timeline data with a filter containing an or statement applied (again the advanced filter window was included in the screenshot).

Find
Calc supports the ability to find the next instance of a variable or to find all instances of a variable. The find next option in Calc is very similar to Excel but the find all option in Calc doesn't provide you with a quick method for reviewing all of the rows with the variable(s) like Excel. I will first demonstrate the find next functionality then I will demonstrate the find all functionality. To access Calc’s find and replace functionality you can use CTRL + F, select Edit > Find & Replace, or click the find and replace icon (binoculars image) as shown below.

The picture below shows the options available in the Find and Replace window. Similar to the filters, the regular expression option must be selected if the variable contains regular expressions. The Find button is used to find the next instance of the variable while the Find All button will find all instances of the variable in the timeline.
The picture below shows how Calc finds the next instance of the variable aaclient.

The similarities between Calc and Excel can be seen by comparing the picture above with the below picture of Excel’s find next window.

Using the same variable, I selected the Find All button to demonstrate this functionality. The only visible difference with using find all is the background color of the box containing the variable changes.

You have to browse the timeline in order to find the other instances of the variable. I think this is a significant difference compared to Excel because the manual browsing makes it more challenging when working with a large dataset since a row could be overlooked. The picture below shows two other rows containing the variable aaclient.

Calc’s find all functionality is the one area I felt was lacking when compared to Excel. Excel provides a way to quickly locate all of the instances which makes examining the timeline faster and more efficient. The picture below shows how Excel provides this ability to quickly locate rows containing the variable being searched for.

Conclusion
Every tool has its advantages and disadvantages. In one instance a tool may better suit your needs while in a different situation another tool may be the better option. Calc is just another tool that can be used to review timelines and it will have a place in my toolbox.
I wanted to thank the anonymous reader for posting their comment. Not only did I find the comparison of Calc and Excel to be interesting but I also learned how to review timelines with the program.


