skip to main |
skip to sidebar
Tuesday, January 28, 2014
Posted by
Corey Harrell
I have always maintained a strong separation between jIIr -which is my personal blog - and the work I do for my employers. For one time, for one post I'm blurring the lines between my personal publishing platform and work I did for an employer. I previously posted about My Journey into Academia where I discussed why I went from DFIR practitioner to DFIR educator. I'm continuing the journey by discussing the course I designed for Champlain College's Master of Science in Digital Forensic Science (MSDFS) program. My hope is by sharing this information it will be beneficial to those developing DFIR academia curriculum and those going from DFIR practitioner to DFIR educator.
Why Academia Recap
My Journey into Academia post goes into detail about the issue where some academic programs are not preparing their students for a career in the digital forensic and incident response fields. How students coming out of these programs are unable "to analyze and evaluate DFIR problems to come up with solutions." In the words of Eric Huber in his post Ever Get The Feeling You’ve Been Cheated?:
"It’s not just undergraduate programs that are failing to produce good candidates. I have encountered legions of people with Masters Degrees in digital forensics who are “unfit for purpose” for entry level positions much less for positions that require a senior skill level."
As I said before, my choice was simple: to use my expertise and share my insight to improve curriculum; to put together a course to help students in their careers in the DFIR field.
Why Champlain College
Years ago I went to my first DFIR conference where I met Champlain's MSDFS program director at the time. One of the discussions we had was about the program being put together. A program that was supposed to not only help those looking to break into the field but to benefit those already in the field by covering advanced forensic topics.
Years later when an opportunity presented itself for me to develop the Malware Analysis course for Champlain's MSDFS program I remembered this discussion. I always heard great things about Champlain's programs and it was humbling to be offered this chance. It was even better when I took a look at the MSDFS curriculum. Seeing courses like: Operating System Analysis, Scripting for Digital Forensics, Incident Response and Network Forensics, Mobile Device Analysis, and then adding Malware Analysis to the mix. The curriculum looks solid covering a range of digital forensic topics; a program I could see myself associated with.
For those who don't want to pursue a Master's degree can have access to the same curriculum through their Certificates in Digital Forensic Science option. An option I learned about recently.
DFS540 - Malware Analysis Course
How can you reverse malware if you are unable to find it? How can you find malware without identifying what the initial infection vector is? How can you identify the initial infection vector without knowing what artifacts to look for? How can you consistently explore artifacts without a repeatable process to follow? How can you carry out a repeatable process with having the tools to do so? I could go on but this adequately reflects the thought process I went through when developing the curriculum. Basically, the course had to explore malware in the context that a DFIR practitioner will encounter it. To me, the best way to approach building the course was by starting with the course objectives and the following were the ones created (posted with permission):
- Evaluate the malware threat facing organizations and individuals
- Identify different types of malware and describe their capabilities including propagation and persistence mechanisms, payloads and defense strategies
- Categorize the different infection vectors used by malware to propagate
- Examine an operating system to determine if it has been compromised and evaluate the method of compromise
- Use static and dynamic techniques to analyze malware and determine its purpose and method of operation
- Write reports evaluating malware behavior, methods of compromise, purpose and method of operation
Course Textbooks
After the course objectives were created the next item I took into consideration was the reading materials. One common question people ask when discussing academic courses is what the courses’ textbooks are. I usually have mixed feelings about this question since the required readings always extend beyond textbooks. The Malware Analysis course is no different; the readings include white papers, articles, blogs, reports, and research papers. However, knowing the textbooks does provide a glimpse about a course so the ones I selected (as of the date this post was published) were:
Szor, P. (2005). The Art of Computer Virus Research and Defense. Upper Saddle River: Symantec Press.
Russinovich, M., Soloman, D., & Ionescu, A. (2012). Windows Internals, Part 1 (6th ed.). Redmond: Microsoft Press.
Honig, A, & Sikorski, M. (2012). Practical Malware Analysis: The Hands on Guide to Dissecting Malicious Software. San Francisco: No Starch Press.
Ligh, M., Adair, S., Hartstein, B., & Richard, M. (2011). Malware Analyst’s Cookbook and DVD: Tools and Techniques for Fighting Malicious Code. Indianapolis: Wiley Publishing.
Course Curriculum
I started creating the curriculum after the objectives were all set, the readings were identified, and most of my research was completed (trust me, I did plenty of research). When building out the curriculum its helpful to know what format you want to use. Similar to my collegiate experience (both undergraduate and graduate), I selected the traditional teaching methods for the course such: lectures, readings, discussions, laboratories, and assignments. I made every effort to make sure the weekly material covered by each teaching method tied together as well as the material from each week.
Developing Weekly Content
To illustrate how the weekly material ties together I thought it would be useful to discuss one week in the course; the course's second week material which explores anti-forensics and Windows internals. Each week (eight in total) begins with a recorded lecture. The lectures either convey information that is not discussed in the readings - such as a process - or re-enforces the information found in the readings and lab. The week two lecture explores anti-forensics to include: what it is, its strategies, and its techniques to defeat post mortem analysis, live analysis, and executable analysis. When dealing with malware whether on a live system (including memory images), powered down system, or the malware itself it's critical to know and understand the various anti-forensics techniques it may leverage. Without doing so may result in an analyst missing something or reaching false conclusions. Plus, anti-forensics techniques provide details about malware functionality and can be used as indicators to find malware.
The week two readings continue exploring anti-forensics as well as self protecting strategies used by malware. The readings also go in-depth on Windows internals to explore covering items such as system architecture, registry, processes, and threads. All of the readings explore topics crucial for malware forensics and analysis.
Even though this is an online course I made a strong emphasis on the weekly labs so students explore processes, techniques, and tools. The week two lab ties together the week's other material by exploring how two malware samples use the Windows application programming interface to conceal data with different anti-forensic techniques.
The remaining weeks in the course ties together the material in a similar way I described for the second week. (There is more to the second week's material but I didn't think it was necessary to disclose every detail). The topics explored in the other weeks include but isn't limited to:
- Malware trends
- Malware characteristics
- Memory forensics
- Malware forensics
- Timeline analysis
- Static and dynamic malware analysis
Assignments
The curriculum wouldn't be complete without requiring the students to complete work. In addition to weekly discussions about engaging topics there needs to be assignments to engage and challenge students. The assignments need to tie back to the course objectives and this was another area I made sure of. I'd rather not disclose the assignments I put together for the course or my thought process behind creating them. However, I will discuss one assignment that I think truly reflects the course; the final assignment. Students are provided with a memory image and a system forensic image and then are tasked with meeting certain objectives. Some of these objectives are: finding the malware, identifying the initial infection vector, analyzing any exploits, analyzing the malware, and conveying everything they did along with their findings in a digital forensic report.
Summary
In the end, the Malware Analysis course is just one of the courses in Champlain's MSDFS and certificate in digital forensic science programs; a course I would have killed to take in my collegiate career. A course with material that cannot be found in any training.
Developing the course has been one of the most challenging and rewarding experiences in my DFIR career. Not only did I develop this course but I'm also the instructor. One of the best experiences so far about my journey into academia has been watching the growth of students. Seeing students who never worked a malware case successfully find malware, identify the initial infection vector, analyze the malware, and then communicate their findings. Seeing students who already had DFIR experience become better at working a malware case and explaining everything in a well written report. My posts about academia may come to a close but the journey is only just beginning.
Tuesday, January 14, 2014
Posted by
Corey Harrell
Computer users are confronted with a reoccurring issue every day. This happens regardless if the user is an employee doing work for their company or a person doing online shopping trying to catch the holiday sales. The user is using their computer and the next thing they know it is infected with malware. Then someone gets tasked with resolving the malware issue and one of the first things they need to do is to find the malware. This is a common occurrence that plays out every day to anyone who either uses a computer or is responsible for protecting a network. How the malware gets found depends on the person. Some fire off antivirus scanners, others examine memory, some follow a documented process, and others are not sure where to start. I've talked about my detailed process numerous times and I even shared one of my triage techniques last year. Regardless of the process used, there is one examination step that stands above the rest in locating malware on a system. This step is examining the program execution artifacts.
What Malware Indicators to Look For
As the name implies program execution artifacts show what programs executed on a system and at times what programs were present on the system. The significance of knowing what programs ran can be seen in my corollary to the Rootkit Paradox:
1. They need to run
2. They want to remain hidden
Malware wants to remain hidden on a system so it can accomplish what it was designed to do. However, in order for malware to hide on a system a program has to run. This program executes to either hide itself or another piece of malware; in the process it will leave artifacts on the system. These artifacts - program execution artifacts - can be used to find where the malware is hidden. Below are the malware indicators to look for as the program execution artifacts are reviewed (my post Triaging Malware Incidents shows how to use these indicators for triaging).
- Programs executing from temporary or cache folders
- Programs executing from user profiles (AppData, Roaming, Local, etc)
- Programs executing from C:\ProgramData or All Users profile
- Programs executing from C:\RECYCLER
- Programs stored as Alternate Data Streams (i.e. C:\Windows\System32:svchost.exe)
- Programs with random and unusual file names
- Windows programs located in wrong folders (i.e. C:\Windows\svchost.exe)
- Other activity on the system around suspicious files
Program Execution Artifacts
Program execution artifacts have been well documented over the years. For example, Harlan put together a post explaining how to determine what programs executed on a system. The key to finding malware is to look for the above indicators in the program execution artifacts and to review all of the artifacts since each one provides different information. To illustrate why the reviewing program execution artifacts examination step stands above the rest I'll walk through the step against a system I infected with malware.
Parsing Program Execution Artifacts
The purpose of this post is to show how just the program execution artifacts can reveal malware on a system as opposed to the tools one should use. However, for completeness I'm sharing the tools I use to parse these artifacts. I use the autorip script along with RegRipper to parse the majority of the artifacts and Nirsoft Winprefetchview to parse the prefetch files.
RecentFileCache.bcf File
The first artifact to review on Windows 7 systems is the recentfilecach.bcf file. This file shows programs that executed on a system and the majority of the time these programs are new to the system. The programs listed here executed recently; within the last 24 hours or when the ProgramDataUpdater task last ran. The RecentFileCache.bcf on my test system showed the following:
c:\program files\common files\java\java update\jusched.exe
c:\users\lab\appdata\local\microsoft\windows\temporary internet files\content.ie5\i87xk24w\n6up2014[1].com
c:\program files\common files\java\java update\jucheck.exe
The one program that stands out is the n6up2014[1].com program since it's located in the temporary Internet files folder.
Prefetch Files
The next artifact to review to identify malware quickly on a system are the Windows prefetch files. Prefetch files show a wealth of information: program's file path, last run time, run count, and files accessed during start-up. Furthermore, the prefetch file's creation date can indicate when the program first ran. Sorting the parsed prefetch files on my test system by the program's file path makes it easier to spot malware. The image below illustrates this.
Similar to the RecentFileCache.bcf, the first malware indication is a randomly named program (n6up2014[1].com) executing from a temporary folder in a user profile. The n6up2014[1].com prefetch file also provides the time of interest to help locate other malware which is 01/10/14 00:38:25 UTC. Prefetch files contain references to the files accessed during start-up and these references can point to other malware. The image below highlights the winupdates.exe program referenced in the n6up2014[1].com prefetch file.

The winupdates.exe program is suspicious since it's a program that executed from the users profile. Also, the winupdates.exe zone.identifier alternate data stream indicates the program was downloaded from a different security zone (the Internet). Furthermore, the program executed around the same time as the n6up2014[1].com program. Sorting prefetch files by last modification is a fast and simple method to find other malware on the system. The image below shows the prefetch files sorted by last modification time.
The image above didn't highlight any other potential malware but it does reveal the netsh.exe program executed around the same time as the malware. netsh.exe is a program to "administrator can use to configure and monitor Windows-based computers at a command prompt."
AppCompatCache Registry Key
The next artifact to review to identify malware on a system is the AppCompatCache registry key located in the System hive. Mandiant highlighted the significance of this artifact in their article "Leveraging the Application Compatibility Cache in Forensic Investigations." This article not only shows executables that executed on the system but it also shows executables which were present on the system. The AppCompatCache key from my test system also showed the same suspicious programs with malware indicators.
UserAssist Registry Key
Continuing on with the examination the next artifact to review is the userassist registry key located in the user account's NTUSER.DAT hive. This registry key sheds light on "what programs the user has launched via the Explorer shell." The image below shows the portion of the userassist registry key for the user account where the suspicious programs were located and the timeframe of when they executed.
As can be seen, the image doesn't reveal other malware but it does show the user executed their web browser prior to the infection. This information about the potential source of the malware isn't a surprise since the n6up2014[1].com file was located in the temporary Internet files folder and the winupdates.exe had a zone.identifier alternate data stream.
MUICache Registry Key
Continuing on with the examination is reviewing the muicache registry key located in the user account's NTUSER.DAT (for Windows XP) or UsrClass.dat (for Windows 7) hive. The muicache shows programs that ran under the context of the user account and is another area to look for malware indicators. The muicache from my test system didn't reveal any useful information as shown below.
AppCompatFlags Registry Key
The search for malware indicators should continue by reviewing the AppCompatFlags registry key. This artifact contains information about program execution and is more relevant for Windows 8 systems compared to Windows 7. This registry key hasn't been created on my Windows 7 test system as shown below.
Tracing Registry Key
It may be tempting to stop the examination and follow up on the programs already identified but doing so may result in overlooking other malware. The next artifact to review is the tracing registry key located in the System hive. This key may contain program execution for programs with networking capabilities. The tracing registry key from my test system didn't reveal any useful information as shown below.
Legacy Registry Keys
The last program execution artifact to review is the legacy registry keys located in the System hive. These keys can be helpful to locate malware which installs itself as a Windows service. The legacy registry keys from my test system didn't reveal any useful information as shown below (notice the lack of entries for my timeframe of interest).
Wrapping Things Up
Solely focusing on examining the program execution artifacts identified malware on the test system. Specifically, the following malware was identified:
C:\Users\lab\AppData\Local\Microsoft\Windows\Temporary Internet Files\Content.IE5\I87XK24W\n6up2014[1].com
C:\Users\lab\AppData\Roaming\winupdates.exe
In addition to locating malware it was also determined the netsh.exe program executed around the same time as the infection. The activity identified in the program execution artifacts matches the activity observed when analyzing the n6up2014[1].com program. n6up2014[1].com creates on the system and executes the winupdates.exe program while netsh.exe is used to modify the Windows firewall.
Knowing the information discovered by reviewing program execution artifacts will empower anyone who is tasked with resolving a malware issue. This is the same technique I have been using for years to find malware on systems extremely fast. Normally I can find malware in minutes; in less than 10 minutes. This is why I stand by my comment examining program execution artifacts stands above the rest of the examination steps in locating malware on a system. This is why my response to anyone asking for help in locating malware is to start by examining the program execution artifacts.
Wednesday, January 1, 2014
Posted by
Corey Harrell
Data destruction is an anti-forensic technique where data is deleted to limit the amount of forensic evidence left on a system. One data destruction anti-forensic technique leveraged by malware are self-deleting droppers and downloaders. The use of this technique can be seen in the Damballa paper Behind Today's Crimeware Installation Lifecycle: How Advanced Malware Morphs to Remain Stealthy and Persistent which outlines the malware installation lifecycle. In Windows, a program cannot delete itself so malware has to use other avenues to accomplish this. The article Self-deleting Executables: Techniques which allow an executable file to delete itself whilst running goes into detail about these avenues while the article ZeroAccess's Way of Self-Deletion discusses another one. A common avenue used by malware to limit the available forensic evidence is the self-deleting batch file method. If this method is used then there may be evidence of this activity in the Windows prefetch files and NTFS Change Journal.
Self-Deleting Batch File Method
The Catch22 Self-deleting Executables article discusses the self-deleting batch file method. The article states the method "works because MS-DOS batch files are able to delete themselves." All an executable has to do if it wants to delete itself is to create a batch file with code to delete its executable." Next the executable needs to spawn off the batch file using CreateProcess, and then should exit immediately". The batch script will proceed to delete the executable then itself. On a system this action removes valuable information about the infection vector.
To see how this method works I'll use the following Zbot sample MD5 0dc43fa765b042c13b51667e9c05d6e7. The image below shows the malware (bot.exe) creating a batch script named tmp1d2cc71c.bat.
The purpose of the tmp1d2cc71c.bat batch script is to delete the bot.exe executable and then to delete itself as shown in the image below. Notice the "if exist" statement creates a loop to force the bot.exe deletion.
Shortly after the tmp1d2cc71c.bat batch script creation the malware proceeds to launch a command prompt to execute the script.
Looking at the "Process Create" event details shows the command-line the malware used to start the command prompt.
The command prompt proceeds to load; one activity that occurs during process creation is the creation and/or reading of the command prompt prefetch file.
The command prompt uses the SetDispositionInformationFile function to delete the bot.exe file. The ZwSetInformationFile routine with the FileDispositionInformation parameter "sets the DeleteFile member of a FILE_DISPOSITION_INFORMATION to TRUE, so the file can be deleted when ZwClose is called to release the last open handle to the file object." In other words, the bot.exe file gets deleted when it is closed. The images below show this event in process monitor and the properties of this event where the DeleteFile member is set to True.
Remember the "if exist" statement in the batch script? The image below shows cmd.exe checking to see if the bot.exe exists. The result is "no such file" so the script exits the loop and continues its execution.
Again, the command prompt uses the SetDispositionInformationFile function to delete the tmp1d2cc71c.bat batch script before it exits.
Traces of the Self-Deleting Batch File Method
The self-deleting batch file method used by downloaders and droppers limits the amount of forensic evidence left on a system. Specifically, it removes the downloaders and droppers themselves so they can't be analyzed in a method similar to the process above. However, this method leaves traces on a system to help determine that this method was used. I've seen these traces numerous times left in the Windows prefetch files and the NTFS Change Journal.
Prefetch Files
Windows prefetch files contain file paths to the files accessed when the application was starting. Sometime ago Harlan touched on this in his post Prefetch Analysis, Revisited...Again... and I did as well in my post Second Look at Prefetch Files. Traces of the self-deleting batch file method may be left in the command prompt (cmd.exe) prefetch file; this is usually my first indication that this method was used.
Again, let's illustrate this with the Zbot sample MD5 0dc43fa765b042c13b51667e9c05d6e7. The image below shows some suspicious executables (bot.exe and anku.exe) prefetch files followed by a modification to the cmd.exe prefetch file. Note: the modification to the cmd.exe prefetch file may not always align with the malware prefetch files if the command prompt has been used since the initial infection.
The indication that the self-deleting batch file method was used are references to batch scripts located in temporary folders. Looking closer at the cmd.exe prefetch file - as shown below - contains a reference to the tmpccc11cdb.bat batch script which is located in the temp folder.
NTFS Change Journal
The NTFS Change Journal ($UsnJrnl) contains a wealth of information about file system activity which can provide more context about what occurred on a system. I discussed the importance of this artifact in the post Re-Introducing $UsnJrnl and I even showed how it can help identity the self-deleting batch file method. The $UsnJrnl can help provide more context about the tmpccc11cdb.bat batch script found in the cmd.exe prefetch file.
The image below shows how the $UsnJrnl recorded the creation of the malware with the file name bot.exe.
The $UsnJrnl even records activity for other malware that gets dropped onto the system such as for the executable anku.exe as shown below.
The image below shows the traces of the self-deleting batch file method in the $UsnJrnl. First the batch script (tmpccc11cdb.bat) is created which is followed by the deletion of an executable (bot.exe) and the batch script itself (tmpccc11cdb.bat).
Wrapping Things Up
When we are confronted with systems impacted by malware it is a given we will encounter numerous anti-forensics techniques. Most likely we will see less forensic evidence left on a system due to data destruction. As the Locard's exchange principle states when two objects come into contact, something from one is exchanged to the other. This principle applies to anti-forensics and traces of this activity may be left on the system. Together, prefetch files and the NTFS Change Journal can shed light on the activity for the self-deleting batch file method.
Tuesday, December 17, 2013
Posted by
Corey Harrell
The Application Experience and Compatibility feature ensures compatibility of existing software between different versions of the Windows operating system. The implementation of this feature results in some interesting program execution artifacts that are relevant to Digital Forensic and Incident Response (DFIR). I highlighted a Windows 7 artifact in the post Revealing the RecentFileCache.bcf File and Yogesh Khatri highlighted a Windows 8 artifact in his post Amcache.hve in Windows 8 - Goldmine for malware hunters. However, there are still even more artifacts associated with this feature and the AppCompatFlags registry keys are one of them. This post provides some additional information about these registry keys in the Windows 7 and 8 operating systems and the relevance of the data stored within them.
Exploring the Program Compatibility Assistant
The Program Compatibility Assistant (PCA) is another technology the Windows operating system uses to ensure software compatibility between different Windows versions. The Windows Internals, Part 1: Covering Windows Server 2008 R2 and Windows 7 in the built-in diagnostic utilities section states the following about PCA:
Program Compatibility Assistant (PCA), which enables legacy applications to execute on newer Windows versions despite compatibility problems. PCA detects application installation failures caused by a mismatch during version checks and run-time failures caused by deprecated binaries and User Account Control (UAC) settings. PCA attempts to recover from these failures by applying the appropriate compatibility setting for the application, which takes effect during the next run. In addition, PCA maintains a database of programs with known compatibility issues and informs the users about potential problems at program startup.
The Program Compatibility Assistant is a Windows service. It's service display name is Program Compatibility Assistant Service, service name is PcaSvc and its default description states "this service provides support for the Program Compatibility Assistant (PCA). PCA monitors programs installed and run by the user and detects known compatibility problems. If this service is stopped, PCA will not function properly." The screenshot below shows the Windows 7 PCA service's properties including the path to the executable which is "svchost.exe -k LocalSystemNetworkRestricted."
The article The Program Compatibility Assistant - Part Two goes into a little more detail about how PCA works. It mentions the following:
"When a user launches a program, if that program is on a list of programs that are known to have compatibility issues, then PCA informs the user of this. This list is maintained in the System Application Compatibility Database. Depending on the nature of the issue, the application may be Hard Blocked or Soft Blocked."
A hard block prevents the application from running or installing while a soft block indicates the program has known compatibility issues. The process creation stages were detailed in the post Revealing the RecentFileCache.bcf File; if you are not familiar with the process it's recommend to read the article.
Exploring the HKU AppCompatFlags Layers Registry Keys
The Program Compatibility Assistant uses compatibility modes to help programs run on Windows. These compatibility modes are set in the following registry keys (which one is used depends on if the setting is for all users or the current user):
HKLM\ Software\Microsoft\Windows NT\CurrentVersion\AppCompatFlags\Layers
HKCU\Software\Microsoft\Windows NT\CurrentVersion\AppCompatFlags\Layers
For each compatibility setting there is a registry value listed beneath the Layers registry key. The value contains: the path to the executable and the compatibility mode being applied. To illustrate how this works I'll walk through the FTK imager installation process on a Windows 7 system. The picture below shows FTK imager's file properties with the Windows XP (Service Pack 3) compatibility mode selected. This setting only applies to the current user; for it to apply to all users the "Change settings for all users" must be used.
After applying the compatibility setting the registry value is updated beneath the Layers key as shown below.
This compatibility setting is queried during the process creation stages. The image below shows Explorer.exe starting the AccessData FTK Imager_3.1.22_Copy.exe process.
The image below shows the compatibility setting being queried during the process creation.
Exploring the Windows 7 AppCompatFlags Persisted Registry Key
The article The Program Compatibility Assistant - Part Two goes into further detail about how PCA works. Besides the Layers registry key, " PCA stores the list of all programs for which it came up under the following key for each user, even if no compatibility modes were applied (in other words, the user indicated that the program worked correctly)." In Windows 7, it appears that PCA records the programs that have an installation routine inside the user account registry hive it executed under. The registry location is:
HKCU\Software\Microsoft\Windows NT\CurrentVersion\AppCompatFlags\Compatibility Assistant\Persisted
To illustrate how this works I'll again walk through the FTK imager installation process on a Windows 7 system. (note: I tested various programs without installation routines but none of them were recorded in the Windows 7 Persisted registry key). The image below shows the FTK imager process starting.
The next image shows the Application Experience service modifying the RecentFileCache.bcf file since the AccessData FTK Imager_3.1.22.exe file was recently created.
Up to this point in the process creation it is very similar to what I described in the post about the RecentFilecache.bcf file. However, the next image shows the PCA process becoming more active.
The properties of the svchost.exe process confirms it is in fact the Program Compatibility Assistant service as shown below:
The PCA service performs various activities as the FTK Imager application starts to load. One of those activities is querying the registry key HKCU\Software\Microsoft\Windows NT\CurrentVersion\AppCompatFlags\Compatibility Assistant\Persisted as shown below:
Shortly thereafter the PCA service modifies the Persisted registry key as shown below.
This modification is to record the AccessData FTK Imager_3.1.22.exe file that executed on the system. The other programs listed in the Persisted registry key all had installation routines when they executed.
Exploring the Windows 8 AppCompatFlags Store Registry Key
In Windows 8, the Program Compatibility Assistant appears to function similar to the process I described previously. However, there is one key difference in Windows 8. It appears that PCA records all third party programs inside the user account registry hive it executed under regardless if it has an installation routine or not. The Persisted registry key is no longer present and the data is stored in the location below:
HKCU\Software\Microsoft\Windows NT\CurrentVersion\AppCompatFlags\Compatibility Assistant\Store
To illustrate how this works I'll through the Process Explorer program executing on a Windows 8 system. Process Explorer is a standalone program so it doesn't have an installation routine. The walkthrough I'm doing is very similar to programs with installation routines running on Windows 8. The image below shows the Process Explorer starting.
For brevity I'm excluding other images in the process creation and only showing the activity related to PCA. The image below shows PCA accessing the application compatibility database.
PCA continues by querying the File registry key inside the Amcache.hve registry hive. In Windows 8, this registry hive replaces the RecentFilecache.bcf file. For more information about this new artifact refer to the posts: Yogesh Khatri's Amcache.hve in Windows 8 - Goldmine for malware hunters and Amcache.hve - Part 2.
PCA queries various locations as Process Explorer starts to load; one of them is the registry key HKCU\Software\Microsoft\Windows NT\CurrentVersion\AppCompatFlags\Compatibility Assistant\Store as shown below.
The other activity PCA does with the store registry key is to record information about Process Explorer as shown below.
Looking at the registry values in the Store registry key shows it contains references to various third party applications. The applications are ones without installation routines (procmon.exe, Tweb.exe, and procexp.exe) as well as ones with installation routines (FTK imager and FoxIt). The Store registry key even ties applications to Internet Explorer (Tweb.exe).
AppCompatFlags Registry Keys' Relevance
The AppCompatFlags registry keys' are another artifact that shows program execution. The following are some of the relevant registry keys:
HKLM\ Software\Microsoft\Windows NT\CurrentVersion\AppCompatFlags\Layers
HKCU\Software\Microsoft\Windows NT\CurrentVersion\AppCompatFlags\Layers
HKCU\Software\Microsoft\Windows NT\CurrentVersion\AppCompatFlags\Compatibility Assistant\Persisted
HKCU\Software\Microsoft\Windows NT\CurrentVersion\AppCompatFlags\Compatibility Assistant\Store
The relevance of the executables listed in these keys mean the following:
1. The program executed on the system.
2. The program executed on the system under the user account where the keys are located
Monday, December 2, 2013
Posted by
Corey Harrell
The Application Experience and Compatibility feature is considered one of the pillars in the in Microsoft Windows operating systems. Microsoft states in reference to the Microsoft Application Compatibility Infrastructure (Shim Infrastructure) "as the Windows operating system evolves from version to version changes to the implementation of some functions may affect applications that depend on them." This feature is to ensure compatibility of existing software between different versions of the Windows operating system. The implementation of this feature results in some interesting program execution artifacts that are relevant to Digital Forensic and Incident Response (DFIR). Mandiant highlighted one artifact in their Leveraging the Application Compatibility Cache in Forensic Investigations article. However, there are more artifacts associated with this feature and the RecentFileCache.bcf file is one of them. This post provides some clarification about the file and the relevance of the data stored within it.
Exploring the Application Experience and Compatibility Feature
Microsoft further states why the Application Experience and Compatibility feature is needed:
"Because of the nature of software, modifying the function again to resolve this compatibility issue could break additional applications or require Windows to remain the same regardless of the improvement that the alternative implementation could offer."
The Shim Infrastructure allows for those broken applications to be fixed and ensures they are compatible with newer versions of Windows. The Shim Infrastructure leverages API hooking to accomplish this. When there are calls to external binary files the calls get redirected to the Shim Infrastructure as illustrated below:

Alex Ionescu's goes into more detail about what happens when the external binary calls get redirected to the Shim Infrastructure in his post Secrets of the Application Compatilibity Database (SDB) – Part 1. "As the binary file loads, the loader will run the Shim Engine, which will perform lookups in the system compatibility database, recovering various information." The compatibility database is named sysmain.sdb and is located in the C:\Windows\AppPatch directory. sysmain.sdb contains information "that details how the target operating system should handle the application" and covers more than 5,000 applications. Furthermore, Alex states " on top of the default database, individual, custom databases can be created, which are registered and installed through the registry."
There is very little information available about what is the Windows process that the loader calls to perform the compatibility database checks. However, monitoring the Windows operating system with Process Monitor identified one of the Shim Infrastructure processes being the Application Experience.
Application Experience is a Windows service. It's service display name is Application Experience, service name is AeLookupSvc and its default description states it "processes application compatibility cache requests for applications as they are launched." Another reference mentions "this service checks a Microsoft maintained database for known problems with popular programs and automatically enables workarounds, either at first installation (using UAC) or at application launch." The service performs these checks as applications are launched (on Windows XP this was handled by the Application Experience Lookup service). The screenshot below shows the Application Experience service's properties including the path to the executable which is "svchost.exe -k netsvcs."

In addition to the Application Experience service, there are two Windows tasks involved with the Application Experience and Compatibility feature. The two default tasks for Application Experience are named AitAgent and ProgramDataUpdater. The description for the AitAgent task states it "aggregates and uploads Application Telemetry information if opted-in to the Microsoft Customer Experience Improvement Program." The second and more important task as it relates to the RecentFilecache.bcf file is the ProgramDataUpdater. It's description states it "collects program telemetry information if opted-in to the Microsoft Customer Experience Improvement Program." The other item to note about this task is its action which is to start the following program: %windir%\system32\rundll32.exe aepdu.dll,AePduRunUpdate. As with every Windows task there is information about when the task is scheduled to run and when it last ran. The screen below shows this information for the Application Experience tasks.

The one thing to keep in mind is since it impacts the RecentFileCache.bcf file is that the ProgramDataUpdater task is scheduled to run every day at 12:30 AM.
Exploring Process Creation on Windows
The Application Experience and Compatibility feature comes into play as a program starts. To fully explore how this feature works it is necessary to review how processes are created on Windows and what occurs when the loader runs the Shim Engine. The Windows Internals, Part 1: Covering Windows Server 2008 R2 and Windows 7 outlines the main stages of process creation:
1. Validate parameters; convert Windows subsystem flags and options to their native counterparts; parse, validate, and convert the attribute list to its native counterpart.
2. Open the image file (. exe) to be executed inside the process.
3. Create the Windows executive process object.
4. Create the initial thread (stack, context, and Windows executive thread object).
5. Perform post-creation, Windows-subsystem-specific process initialization.
6. Start execution of the initial thread (unless the CREATE_ SUSPENDED flag was specified).
7. In the context of the new process and thread, complete the initialization of the address space (such as load required DLLs) and begin execution of the program.
The picture below illustrates the process creation main stages:
The loader runs the Shim Infrastructure in stage 5 of the process creation which is where performing Windows subsystem-specific-post-initialization occurs. This is where specific operations are performed to finish initializing the process. According to the Windows internal book, one of those operations is "the application-compatibility database is queried to see whether an entry exists in either the registry or system application database for the process."
Exploring this portion of the process creation with Process Monitor reveals the files, registry keys, and processes involved with the database being queried. To demonstrate I'll follow the lead of the Windows Internal book by using the built-in Windows program notepad.exe. Notepad.exe was invoked by double clicking it; this means Explorer.exe is process that loads notepad.exe.
Explorer.exe performs other activity as illustrated below:
The Windows Internal book states the following about this activity:
"The first is a simple check for application-compatibility flags, which will let the user-mode process creation code know if checks inside the application-compatibility database are required through the shim engine."
In addition the book goes on to say
"you might see I/O [input/output] to one or more .sdb files, which are the application-compatibility databases on the system. This I/O is where additional checks are done to see if the shim engine needs to be invoked for this application."
Exploring the RecentFileCache.bcf File
The Application Experience and Compatibility feature is implemented through the Shim Infrastructure. This Shim Infrastructure is invoked during process creation when an application is launched. However, there was no mention about the RecentFileCache.bcf file located in the C:\Windows\AppCompat\Programs directory on Windows 7 systems. I first became aware about this file when processing malware cases. I kept seeing references (full path names to executables) to malware in the RecentFileCache.bcf file. The file was different than the Shim Cache Mandiant spoke about. The Shim Cache contains references to numerous programs over an extended period of time. The RecentFileCache.bcf file on the other hand only contained references to programs that recently executed. The reason for this is because the RecentFileCache.bcf file is a temporary storage location used during the process creation. It appears this storage location is not used during all process creation; it's mostly used for those processes that spawned from executables which were recently copied or downloaded to the system.
Extensive testing was performed to shed light on the actions which lead to executables names being listed in the RecentFileCache.bcf file. The testing included executing the same program the following ways:
- executing program already on the system
- renaming and then executing the program already on the system
- executing the program from a removable media
- copying the program to the system and then executing it
- downloading the program with a web browser and then executing it
- copying a different program that has an installation process and then executing it
The process creation process varied from what was described previously when it involved an executable that was recently created on the system (either through copying or downloading). The best way to illustrate this difference is by demonstrating it. The picture below shows part of the copying process moving E:\Tcopy.exe to C:\Tcopy.exe.
The next picture shows the part of the process creation where the application compatibility database is checked after C:\Tcopy.exe was executed from the command prompt.
Next there are checks for the application compatibility flags.
To this point the Shim Infrastructure being invoked during process creation resembles what was described previously. However, the next picture illustrates where the process creation starts to deviate. Shortly after the sysmain.sdb database is closed a scvhost.exe process becomes more active.
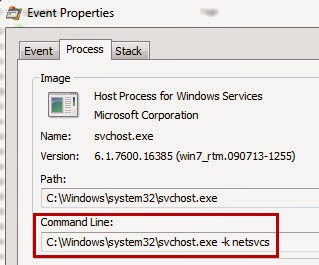
The properties of the svchost.exe shows it is the Application Experience service since it's command line is "svchost.exe -k netsvcs."
The Application Experience service performs various operations. One of its operations records the executable's full path in the RecentFileCache.bcf file as shown below:
The structure of the RecentFileCache.bcf file is fairly basic. Each entry only has the file path length and file path itself.
Harlan Carvey wrote a Perl script to parse the RecentFileCache.bcf file; his script makes it easier to read its contents than using a hex editor. Below is the script's output parsing a file from a test system:
c:\windows\devcon\64bits\devconx64.exe
c:\tcopy.exe
c:\users\ anon\appdata\local\microsoft\windows\temporary internet files\content.ie5\hjhf58cm\tweb.exe
Application Experience and RecentFileCache.bcf
The Application Experience service records the file names of executables in the RecentFileCache.bcf file. These executables were newly created on the system whether if it was copied, downloaded, or extracted from another executable. The storage of this information in the RecentFileCache.bcf file is only temporary since it is cleared when the Application Experience ProgramDataUpdater task is ran.
side note: I have seen references to executables that executed from removable media (i.e. my collection tools) as well as executables that were present on the system but never executed referenced in this artifact. However, I was unable to reproduce either with my testing.
Continuing on with the demonstration, the system was monitored to see what else interacted with the RecentFileCache.bcf file. The services.exe started the Application Experience ProgramDataUpdater task as shown in the two screenshots below.
Shortly thereafter, the Application Experience service started interacting with the ProgramDataUpdater task as shown below.
Further monitoring of the ProgramDataUpdater task showed it accessed the RecentFileCache.bcf file and cleared its contents.
The ProgramDataUpdater task runs at least once a day and knowing it clears the cache means the programs listed in the RecentFileCache.bcf file executed fairly recently. The ProgramDataUpdater task also interacted with the xml file stored inside the AppCompat\Programs folder. This xml file appears to contain the program's publisher information.
RecentFileCache.bcf File's Relevance
The RecentFileCache.bcf file is another artifact that shows program execution. I have found this artifact helpful when investigating systems shortly after they became infected. The artifact is a quick way to locate malware - such as droppers and downloaders - on the system as I briefly mentioned in the post Triaging Malware Incidents. The relevance of the executables listed in this artifact mean the following:
1. The program is probably new to the system.
2. The program executed on the system.
3. The program executed on the system some time after the ProgramDataUpdater task was last ran.
*** Update ***
In the Windows 8 operating system the RecentFilceCache.bcf has been replaced by a registry hive named Amcache.hve. Yogesh Khatri digs into this new artifact and provided an excellent overview about what it contains in the post Amcache.hve in Windows 8 - Goldmine for malware hunters. The Amcache.hve stores a ton of information compared to the RcentFileCache.bcf; one of which are executables SHA-1 hashes.





 Posts
Posts

